Q4 2022 – “How Will the Federal Reserve Ring in the New Year?”

Q4 2022 – “How Will the Federal Reserve Ring in the New Year?”

  Download newsletter in PDF format

The U.S. equity market reversed some year-to-date losses in the 4th quarter but finished 2022 down for the full year. The S&P 500 Index was down 18.11% on a total return basis, the sixth worst calendar-year performance since 1926 and the worst since the 2008 recession (down 37%). The decline followed one of the best three-year runs in history, with annualized returns of just over 26% from 2019-2021; despite the recent weakness, the 4-year annualized return from 2019-2022 was 13.18%, above the long-term average annual index return of 12.01% from 1926-2022. The bond market provided only a modest “safe harbor” as the Bloomberg U.S. Aggregate Fixed Income Index was down 13.01% for the year.

The principal driver of negative performance for both markets was the U.S. Federal Reserve Bank’s (“the Fed”) numerous interest rate hikes during the year in a belated attempt to dampen demand and so quell inflation that was running at 40-year highs. After abandoning the notion that the pandemic-induced high inflation was merely transitory, and further prompted by the significant inflationary impacts of the Russia-Ukraine war, the Fed found itself in catch-up mode and increased the high-end of its overnight Federal Funds Rate target a total of seven times from 0.25% to 4.5%. The market currently expects at least two more Fed Funds hikes in early 2023 and a high of 5-5.25%. The Fed is also tightening monetary supply by allowing its balance sheet to decrease instead of buying securities to replace owned bonds as they mature. The Fed’s messaging is that it will do whatever is necessary to bring inflation closer to its 2% long-term target.

Higher interest rates, including higher short-term rates compared to longer-term rates (i.e., an inverted yield curve), portend weaker economic growth and a potential recession, as consumers’ and companies’ higher costs of funding purchases and investments crimps demand, lowers return on investments, and leaves fewer dollars for discretionary spending. Besides the threat of a recession that would weaken corporate earnings power, higher interest rates reduce the present value of expected future cash flows. This combination explains the harsh market reaction to the Fed’s actions to cool the economy and stifle inflation. The critical questions for investors going into 2023 are how much more tightening the Fed will do to control inflation, how effective those efforts will be, and how material the impact of higher rates will be on the economy and, by extension, corporate earnings.

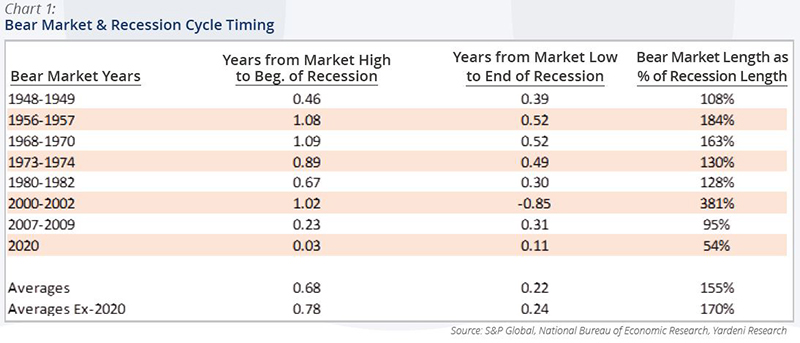
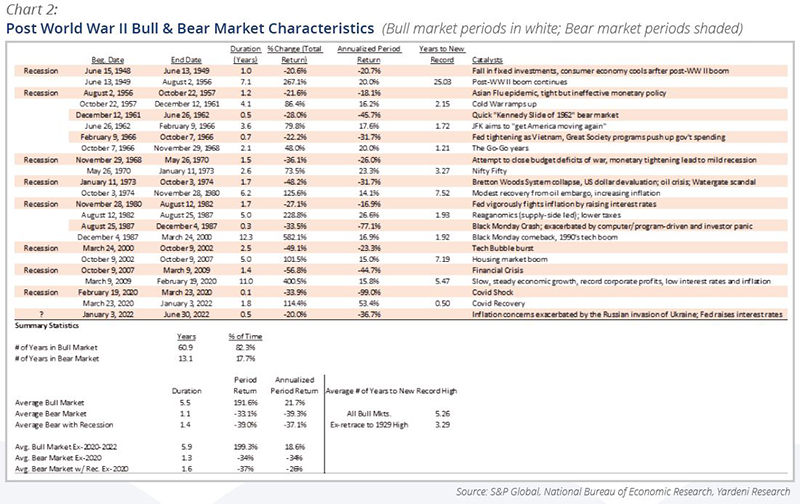
While the potentially weaker growth and related psychology have been quickly reflected in financial asset market prices, there is typically a lagged effect on actual economic performance from higher interest rates that is just now being revealed in the economic data. Given that 5 of the past 6 bear markets have been associated with recessions (the S&P 500 was down 19.8%, just short of a technical bear market, and bottomed during the recession of 1990), understanding the forces that may drive a hard (recession) or soft (low growth without a recession) economic landing is important.

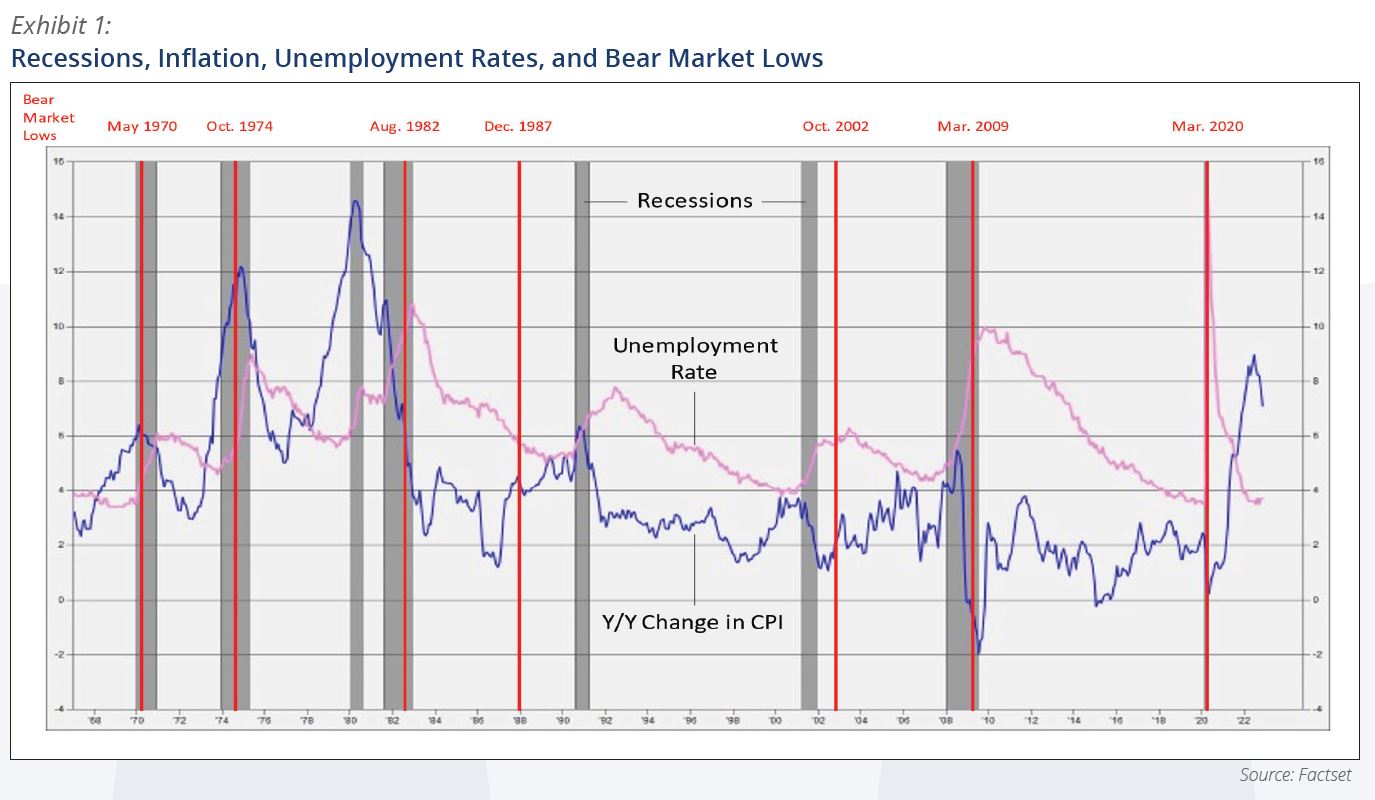
A review of the period from 1967-2022, shown in Exhibit 1, shows that the combination of abnormally high year-over-year inflation and low unemployment rates has been attendant to nearly every recession on record. The exception was the brief pandemic-induced recession of 2020, which was caused instead by an exogenous shock but precipitated the extraordinary monetary and fiscal response and subsequent economic reopening that has led to the present state of high inflation and low unemployment. Using history as a guide, the chart suggests a recession is more likely than not sometime in the coming months. The chart also shows that bear market lows, represented by the red vertical lines, have typically occurred during the technical recession period, suggesting that we could see new lows before a market recovery if we do slide into recession.

The causes of inflation have varied since the pandemic began. Initially, people sequestered themselves at home, increasing demand for upgraded housing that was particularly enabled by the emergency ultra-low interest rates adopted by the Fed and correspondingly low mortgage rates. Demand for goods became elevated compared to demand for services as people stayed home. Coupling the tremendous stimulus funds doled out by the government and the wealth effects of rising home and financial asset prices with supply chain challenges that increased the cost of manufacturing and delivering goods, available supply was lacking compared to demand and goods prices went up. As the economy reopened, demand for services returned. Russia’s invasion of Ukraine exacerbated the inflation situation due to the sudden loss of supply of key commodity inputs such as oil and natural gas, wheat, and fertilizer that are produced there and which are net exports of those countries. The Fed’s (and most other world central banks’) tightening has begun to crimp demand and there are some signs of relief on the inflationary front, but it is not a uniform story.

These trends are illustrated in Exhibit 2, which shows that year-over-year growth in overall U.S. inflation (the broadest blue line) has declined from a 9% high in June to a still historically high 7% in November. It also shows the spikes in energy and goods prices that drove overall CPI growth from 2021 through mid-2022 and the subsequent moderation in those categories in the second half of 2022.

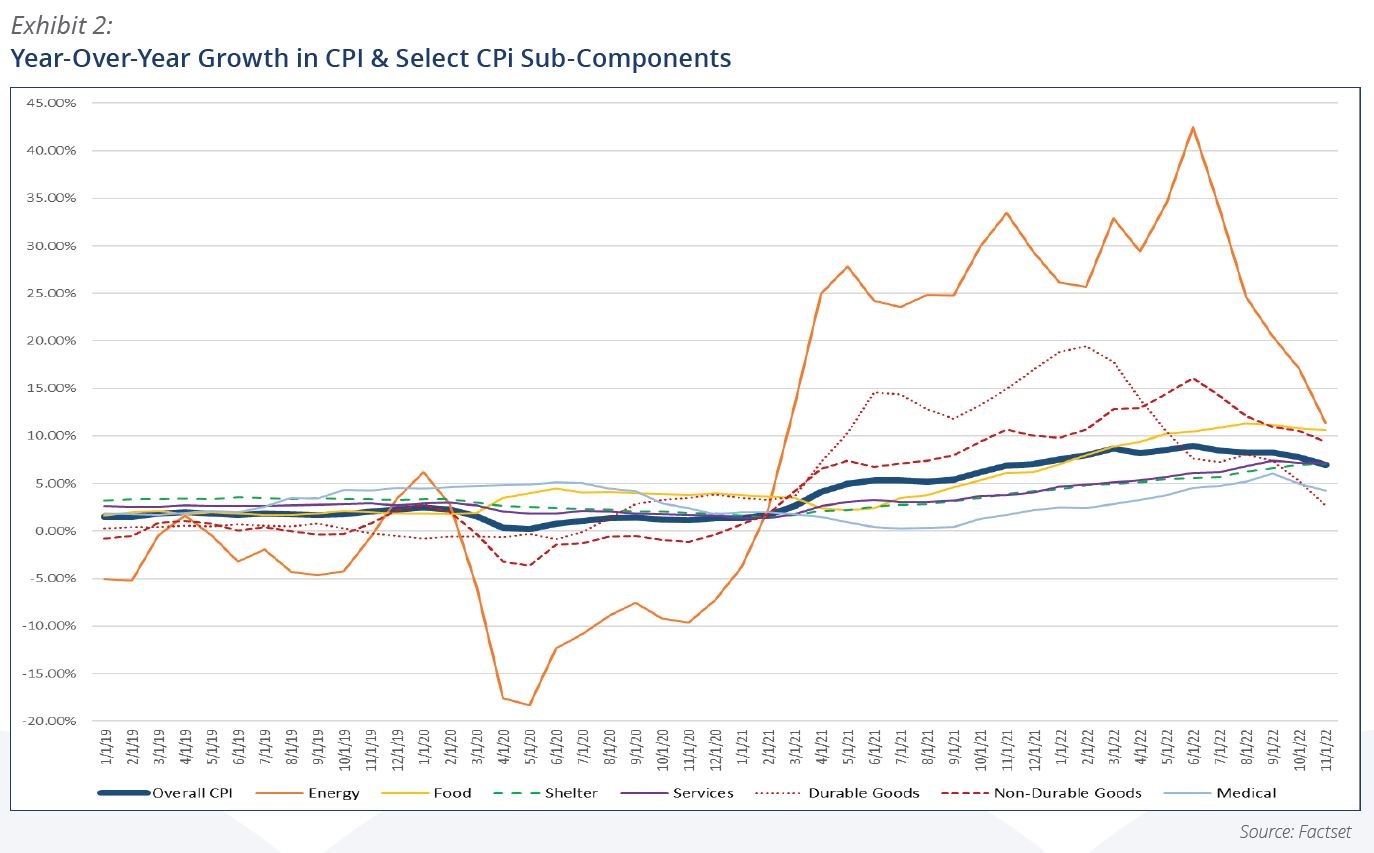
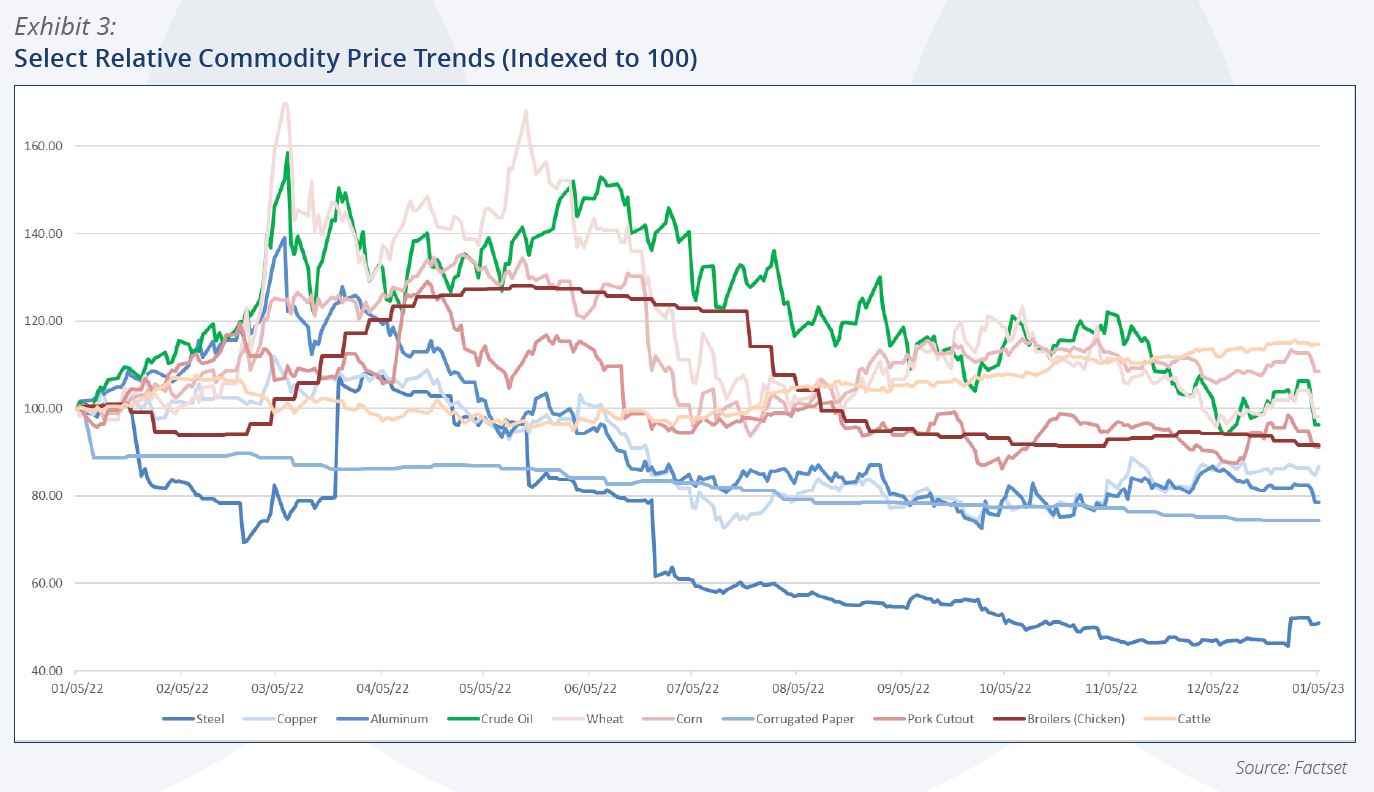
Exhibit 3 shows that higher interest rates have reduced demand, leading to a corresponding reduction in many economically sensitive commodity prices such as steel, aluminum, copper, and cardboard (in blue shades). The chart also shows the contrast with price trends for less discretionary items such as oil (in green) and food (in red shades), for which prices have held up better over the past year.

But wages and income are another key component of inflation given their impact on demand, and unemployment remains below 4%, close to 55-year lows, in part due to a low worker participation rate. Other factors, including retiring baby boomers, declining birth rate trends, and recently limited immigration also have and will contribute to keeping the labor market relatively tight. Though it has not fully kept up with overall inflation levels, year-over-year average hourly earnings in the U.S. has been robust, trending over 6% for most of the last 18 months. Though wage growth has decelerated since the March high of +6.75% (along with the more recent deceleration in overall CPI), the current level is still well above the 30-year average of +3.2%. Complicating the Fed’s inflation-fighting challenge is the fact that unlike commodity prices, wages tend to be stickier and are more difficult for companies to reverse; more typically, wages are reduced by culling employee rolls and resetting salary levels through eventual replacements. But for many industries that need specially trained workers or that have found it challenging to keep their businesses fully staffed or enable growth, that is not a viable option.

Higher consumer prices coupled with the tight labor market have emboldened workers in many industries to demand increased pay, including through threatened or actual strikes. For example, railroad industry workers last year received 24% pay raises that were retroactive to 2020; Delta Airlines recently offered pilots a 34% cumulative raise over three years that is likely to become a benchmark for other airlines; and New York City nurses just went on strike at multiple hospitals. There are other sources boosting income in the U.S., including an 8.7% increase in social security benefits for 2023 due to the legally mandated cost of living adjustment (based on CPI; benefit levels cannot be adjusted downward even if CPI trends negative). The legal minimum wage was above the $7.25/hour federal minimum in 31 states in 2022 and 28 of those states will have increases averaging 8.7% in 2023.

Taken altogether, the economic outlook is murky. Though it would be unprecedented to curb the recent high inflation levels without prompting a recession and increasing unemployment meaningfully, the tight labor market could give the Fed a chance to successfully engineer a soft economic landing, allowing consumers, which account for about two-thirds of economic output, to keep spending at reasonable levels while absorbing higher interest costs.

There are other relevant factors to consider, including likely lower fiscal stimulus under split-party control of Congress, the potential for the Russia-Ukraine war to end sooner than expected, and investments to bring production back to the U.S. to lower supply chain risks highlighted by the pandemic. As the one-year anniversary of the war and related energy price spike passes, it is possible that comparisons to a year ago will bring inflation closer to the Fed’s target even without prices resetting to pre-pandemic levels. Whether we enter a technical recession or not, the timing of the Fed’s signaling that it will cease raising interest rates will be a key to propelling the market to new highs.

We will remain vigilant on behalf of our clients as we analyze newly released economic and corporate data throughout the year and strive to achieve attractive risk-adjusted returns. We are committed to our long-term focus and emphasis on high-quality companies with strong balance sheets and prospects that are undervalued by the markets. We again thank all our valued clients for their trust and conclude by wishing everyone a happy, healthy, and wonderful 2023.

~ KCM Portfolio Management Team ~

Q2 2022 – “Lessons Learned During Previous Bull and Bear Markets”

Q2 2022 – “Lessons Learned During Previous Bull and Bear Markets”

  Download newsletter in PDF format

The U.S. equity and fixed income markets suffered significant losses during the 2nd quarter, as persistent high inflation and a continuation of more mundane but important supply side challenges further soured investor sentiment. The inflation has been driven by overly-stimulative fiscal and monetary policy in reaction to the pandemic, as well as high labor, energy, and other commodity cost inputs driven by supply and demand imbalances. Reasons for the imbalances have been well documented and include underinvestment due to government policies, limiting new supply relative to demand for oil and gas, along with Russia’s invasion of Ukraine exacerbating the supply problem for energy and other key commodities, such as wheat. Progress on supply chain issues were hampered by the recently-ended COVID-related lockdowns in Shanghai and Beijing (where cases have started rising again). The labor market has been tight due to low worker participation rates.

These challenges have prompted the Federal Reserve (the “Fed”) to begin increasing interest rates more aggressively to bring inflation down. Earlier this month the Fed increased its Federal Funds Rate (the price banks charge each other for overnight money) target by 75 basis points (3/4 of 1%), bringing total rate hikes to 1.5% so far this year. Additional short term rate hikes are expected in July, later this year, and into next year, with the aim of quelling inflation by decreasing demand; the Fed’s challenge is successfully taming inflation without causing a recession. The Fed is powerless to increase the supply of key energy products (and higher rates will offset some of the incentive to invest in more capacity provided by higher commodity prices). The market has reacted harshly to this expected slowdown and potential recession, with the major indexes all having reached bear market territory of down 20% or more from the recent highs from early January 2022.

The tables below shows past bull and bear market cycles since the end of World War II, though there are limitations given outlier data exists (e.g., the annualized returns in the COVID periods).

Bear markets associated with recessions have led to higher absolute losses (but similar annualized losses) and have lasted longer at close to 1.5 years. One of the challenges of applying lessons from past bear markets is that recessions are not officially classified until well after they begin and end; moreover, there have been official recessions during periods without a bear market (e.g., the 1953-1954 post-Korean War and the 1990 recessions). Knowing recession start dates would also be of limited help since some market tops have occurred almost simultaneously with the beginning of recessions (e.g., the Great Recession in 2007 and the 2020 COVID Recession) while others have started well in advance (e.g., the market topped about one year in advance of the official beginning of the 1957, 1969, and 2001 recessions).

Historically, bear markets have lasted longer than recessions, and markets have tended to bottom about 3-6 months before the official end of a recession, but there are exceptions, such as the market downturn extending beyond the end of the recession following the “dot.com” bubble burst in the early 2000s. Unsurprisingly, it has usually taken more time to retrace to the previous high, following bigger market declines.

While examining past market cycles is interesting, it does not provide a magic formula for investors trying to determine the market bottom. Many in the press are trying to compare the current situation to prior bear markets/recessions, but there are no perfect parallels. The high-inflation / low-growth period of the mid- to late-1970s is most often cited because of a similar run up in energy prices driving broader inflation. Oil prices first shot up during the first OPEC embargo in 1973-1974 and continued to modestly increase throughout the rest of the decade, until the second oil shock (from lower Iranian oil production following its Islamic Revolution) caused oil prices to more than double from March 1979 to April 1980.

Beyond supply and demand, the U.S. dollar (the currency commodities like oil are priced in) was being devalued relative to other world currencies during the 1970s in the aftermath of the Bretton Woods monetary system collapse, following then-President Nixon’s decision to stop using the gold standard in 1971. The dollar hit a low in October 1978 but did not begin to appreciate substantially and durably until October 1980, just after the oil price peak in April 1980. In contrast, the U.S. dollar has been steadily appreciating over the past year to about 20-year highs against most major currencies, as the higher relative interest rates from Fed tightening help make the dollar comparatively more attractive. The dollar rallied during the bear market of the early 1980s as the Fed began to aggressively raise rates to quell inflation, which contributed to more confidence in the U.S. dollar and decreasing oil prices from 1980 through 1985. And that could happen again throughout this bear market. But dollar strength in this regard might only mean the U.S. is not disadvantaged as much.

Other countries’ weakening currencies might serve to crimp their demand for oil and other commodities even more; the Fed’s actions truly have worldwide consequences. However, though it might help on the commodity price front, an appreciated dollar also makes U.S. exports less competitive, which could hurt companies with significant foreign sales exposure; it would also reduce the amount of earnings reported by companies translating their foreign units’ local earnings. Potentially offsetting to that is the comparative attractiveness of investing in U.S. assets for foreigners expecting continued dollar strength.

There are other differences between then and now. The economy of the 1970s was driven more by demand for goods compared to services, thus arguably making the U.S. economy less vulnerable now to commodity price shocks (though certainly not immune). Chart 3 shows that energy costs are a much smaller share of U.S. consumers’ overall spending now than they were 40-50 years ago and still represents below 5% of total personal consumption expenditures as of late spring, despite oil and natural gas price surges following Russia’s invasion of Ukraine.

It is impossible to know how much the Fed will need to raise interest rates and how long the process will take to bring inflation back to its targeted long-term 2% annualized rate, or how much the economy might grow or contract during this downcycle. It is equally impossible to know exactly how and when the market will react along the way. It will be determined in large part by how effectively the rate hikes work and whether the Fed can manage a soft economic landing during which the higher interest rates slow the economy but do not cause a recession. It will also depend on how quickly supply-related challenges can be overcome. Concerning the latter, it will take time (and, some would argue, less hostile regulation of the oil and gas industry in the U.S.) for energy markets to bring meaningful additional capacity to market. In the meantime, higher interest rates will slow U.S. demand for houses and related home furnishings, cars, and other big ticket goods, and for capital investments by businesses; indeed, most commodity prices, including energy prices, have come down from recent highs during the just-completed quarter in anticipation of interest rate-induced slackening demand.

Additionally, wage inflation tends to be stickier than commodity-induced inflation, and so is worth watching for the longer-term inflationary trend. The labor market has remained tight, and workers have been able to negotiate pay increases (albeit more recently not exceeding inflation), with many businesses struggling to find enough qualified workers. It will be interesting to see if the labor force participation rate ticks up as COVID stimulus savings are used up in the coming months and how that impacts future wage trends.

But the market will have made up its mind long before economists make their backwards-looking proclamations.

As shown in Chart 4, the market’s valuation, as measured by the “price-to-expected next 12 months earnings ratio” is close to the 30-year average, suggesting that the market may not have fully capitulated; additionally, some are fearful that earnings estimates are too high and are bracing for negative earnings estimate revisions. Plus, this bear market is younger than most prior bear markets, suggesting it might be best to wait and be extra selective. Both the Fed and the markets will be carefully watching key economic data to guide future decisions.

The number and pace of interest rate hikes will be driven by inflation, employment, and other key economic data points, and the market will take cues from Fed officials’ commentaries. The market will also be digesting upcoming earnings reports to ascertain how demand and margins are holding up, as it looks for reasons to believe the worst is behind, and climb the proverbial wall of worry into the next bull market. We suspect the markets could be more volatile than usual in the coming months, as economic data indicates which way the economy is heading.

Though the history is mixed, and gleaning specific market timing insights from past bear market cycles is a fraught exercise, we believe KCM’s investment approach works. We believe trying to time the market is a dubious exercise, and that it is important to be patient while waiting for stocks to become attractively-priced based on realistic expectations of companies’ financial prospects (in both bull and bear markets). We believe stocks are one of the most attractive and liquid stores of long-term value that offer a chance for capturing income through dividends and growth over the long term; and that companies with strong management teams, and products and services that are in demand can pass along inflated cost inputs over time to maintain attractive full cycle margins.

As interest rates reset during this cycle, we could get a chance to finally lock in attractive rates on the fixed income side, which in recent years has offered insufficient yield to incentivize moving out farther on the yield curve (i.e., locking in for the long term) or down in quality when compared to the dividends (and potential growth) that could be earned through investment in safe, financially secure equities.

At KCM, we are busy testing assumptions and redoubling our efforts on behalf of clients to confirm that the companies we own are financially-secure and capitalizing on opportunities efficiently. Times like these often present great opportunities for businesses and investors alike, and we aim to help our clients prudently capitalize on them. Many clients have been with us through multiple bear markets and understand that we have the experience necessary to weather them. They know that our focus on high quality companies with strong balance sheets in diversified businesses has worked best during the downturns, and that outperforming in the downturns is a key contributor to superior long-term performance. While not immune from market weakness, those are the kinds of companies that survive during times of economic weakness while preparing for growth when it returns. We appreciate our clients’ loyalty, and endeavor to retain their trust throughout all phases of the market cycle.

~ KCM Portfolio Management Team ~

Q1 2022 – “Despite Economic Headwinds, Positive Indicators Shine Through”

Q1 2022 – “Despite Economic Headwinds, Positive Indicators Shine Through”

  Download newsletter in PDF format

Recent newsletters correctly identified key themes for the markets, but some of the particulars have been unexpected. We highlighted the possibility the equity market could be poised for a break after one of the best three-year performance runs in history, and that inflation and higher interest rates would be critical drivers of market action. Both have indeed ramped up since our last newsletter.

The extraordinary monetary and fiscal stimulus measures taken to boost the economy amidst the COVID pandemic has increased money supply. Coupled with stubbornly persistent and well-documented supply chain challenges, inflation has increased and production of goods (supply) has been limited relative to demand. These challenges remain, as evidenced by China recently shutting down Shanghai, the 3rd largest city in the world, because of COVID. Russia’s atrocious, larger-than-expected invasion of Ukraine has given rise to heightened economic hurdles and uncertainties. Energy and other commodity prices have risen sharply (from already elevated levels), further fueling inflation fears. Disruption from the war and sanctions on Russia will exacerbate the supply-side inflationary problems worldwide in the near-term, and in more ways than many appreciate.

Russia supplies about one-third of Europe’s natural gas, and its pre-war oil production represented about 7-8% of the roughly 100 million barrel per day worldwide demand for oil. The world cannot immediately replace that supply (or portion of it not getting to market) because it lacks immediately-available capacity, and strategic petroleum reserves are not sufficient for reserve releases to have a durable impact on the world’s supply and demand levels. In addition, Russia controls significant market shares for widely-used methanol-derived chemicals, sapphire substrates and rare-earth elements used to make semiconductors, and fertilizer. Also in agriculture, Russia and Ukraine combined produce 12% of the world’s wheat, 18% of its barley, and accounts for 52% of its sunflower oil exports.

Potential lasting shortages (or withholding for retaliatory purposes) of these critical supplies further threatens to limit production of new supply and/or inflate prices for energy, food, and other goods and services as costs are passed through globally. A ceasefire won’t necessarily mean sanctions are lifted.

Besides the potential for inflation to crowd out discretionary spending, another economic headwind is a much lower level of fiscal stimulus this year, after recent COVID-induced extraordinary spending. Plus, student loan payments will no longer be deferred beginning in August, and tax refunds could be lower than expected this year because child tax credits were paid early. The yield curve is signaling a potential looming recession. In all, there is no shortage of economic headwinds to consider. But there are some positives.

The labor market remains strong, as are consumer balance sheets. And there is still a lot of pent up consumer demand for a range of products and services. In addition, inventory-to-sales ratios remain extremely depressed, suggesting eventual economic strength from replenishment, as supply chain issues are resolved. The consumer has been resilient to date.

Historically, equities have acted as a good hedge on inflation, as companies adjust pricing. Many companies have been generating cash and increasing buybacks, dividends, or both. Despite higher inflation, corporate profits have remained robust, with margins holding up well. S&P 500 component companies had 16.89% operating profit margins collectively last year, the highest level ever. Current forecasts point to further increases for this and next year. We will find out more about sales and margin sustainability as companies release their latest quarterly earnings reports in the coming weeks. We expect near-term headwinds to produce more negative than positive earnings revisions and/or less visibility within updated outlooks. But the damage could be limited as the sell-off during the 1st quarter has discounted some of the expected weakness.

The recent rise in interest rates driven by inflation has drawn many comparisons in the popular press to the 1970’s, the last time inflation readings have been this high. The Fed will raise rates as necessary to combat inflation, but nobody knows how high they will get. The potential for near-term, inflation-induced demand destruction could limit how much the Fed needs to do compared to the economy’s self-correcting mechanisms. Supply and demand imbalances will eventually be restored to the commodity markets leading to more normalized prices, though the timing is uncertain. The Fed will try to manage a soft landing, bringing inflation under control with as little damage to the economy as possible.

Despite the uncertainty, it is worth noting some of the important structural differences today that could act as a ballast against rising rates longer term. The US economy is much less energy intensive now when measuring energy consumption versus real GDP (Exhibit 1).

Key drivers of economic growth include the size of the labor force, labor force productivity, and technology employed. One constraint for long-term economic growth, both domestically and worldwide, are the decreasing fertility rates observed in the U.S. and virtually all other economically developed countries. The following Exhibit 2 shows that global fertility rates have come down dramatically. In 2019, the statistically average woman in the world was expected to have 2.4 children, less than half the level of the early 1960’s (the split, thick purple and white sloped line). The dotted lines, from top to bottom, represent low, middle, and high income country aggregates.

Fertility rates are highest in poorer countries, particularly in Africa, the Middle East, and in certain South American countries. The thinner solid lines show the rates for the six highest GDP countries in the world, representing 59% of the world’s GDP and 44% of its population in 2020. The thick, solid, horizontal purple line represents the 2.1 child population replacement rate needed to maintain a population’s size.

Countries with fertility rates below it will experience an aging demographic and a decrease in population size over time, as is happening in the U.S. (see Exhibit 3). This reduces the supply of labor available to fuel economic growth longer term and increases the ratio of working people to retired-age people; projections call for the oldest Americans to make up an increasing proportion of the U.S. population in the coming decades.

Besides the size of the labor pool, U.S. productivity needs to be considered. Excluding 2009 and 2010, when coming out of the Great Recession, U.S. labor productivity has mostly grown at below long-term averages since 2005. Productivity saw its last big spike during the mid- to late-1990’s through the mid-2000’s, as the proliferation of personal computers and automation drove efficiencies. Their increased use contributed significantly to different components of labor productivity growth. Capital intensity accelerated as companies invested more in technology, allowing for more or higher quality equipment per worker.

Exhibit 4 also reveals a positive relationship between capital intensity and labor productivity growth. Capital intensity has declined significantly since the pandemic, which will inhibit near to medium-term economic growth. In addition, the application of PCs, databases, etc. allow for increases of multifactor productivity growth, which is to say advancements in production techniques and other operational efficiencies resulting from the use of technology (e.g., better connectivity between sales and production teams and related improved inventory management).

A key metric to watch is how the prospect of higher interest rates influences the potential reversion to the mean in capital spending. But with business prospects more clouded, it seems dividends and buybacks might be favored over capital expenditures in the immediate future, which could benefit shareholders more than the broader economy. Significant technology advances could drive productivity higher through further automation or utilization of artificial intelligence. However, displacing labor in service industries is harder because tasks are typically not uniform and predictable, requiring judgment, situational awareness, the ability to read human emotions, understand voice tones, etc.

It is difficult to predict what the market and interest rates will do and market timing is a dubious exercise. An overthrow of Putin would likely trigger a significant rally, for example. Commodity markets may take more or less time to correct. As your money manager, we aim to invest in attractively-valued companies that we believe are better positioned given world and market trends. For our clients, we own financially-strong companies in a variety of industries that do well at different points of economic cycles, thus muting return volatility and often providing better performance when the broad indexes are underperforming. We take this opportunity to again thank our clients as we constantly renew our efforts on their behalf.

~ KCM Portfolio Management Team ~