Q4 2018 – “2018 Ended on a Sour Note – How Will 2019 Begin?”

Q4 2018 – “2018 Ended on a Sour Note – How Will 2019 Begin?”

  Download newsletter in PDF format

Worries about rising interest rates, the continuing trade friction between the U.S. and China, and geopolitical tensions tempered risk appetites among investors in the 4th quarter. For the first time since The Great Recession of 2008, the S&P 500 Index posted a loss for the year. From a market cap standpoint, shares of small U.S. companies, as measured by the Russell 2000 Index, underperformed their larger cap S&P 500 peers (-20.2% vs. -6.2%, respectively) in the 4th quarter. This represents a shift from earlier in 2018 when investors shunned larger cap companies for more U.S.-centric, smaller cap companies to mitigate trade tension risks.

We often use an analogy of climbing a tree to represent the market’s temperament in a given cycle. When market valuations are low, as they were at the end of 2008, it’s comparable to starting to climb a tree from the ground up. There isn’t a high degree of risk or a significant distance to fall. However, as one climbs and reaches the upper limits of the tree, the mind starts to focus more on outside variables: the wind, the height above the ground, the brittleness of each branch, etc. Senses tend to be more aware of the variables because of the consequences of a wrong decision. Similarly, when the market is well into an upcycle, such as currently, the data point that didn’t move the market early in the cycle suddenly becomes the most significant factor of the moment and can drive indexes up and down considerably.

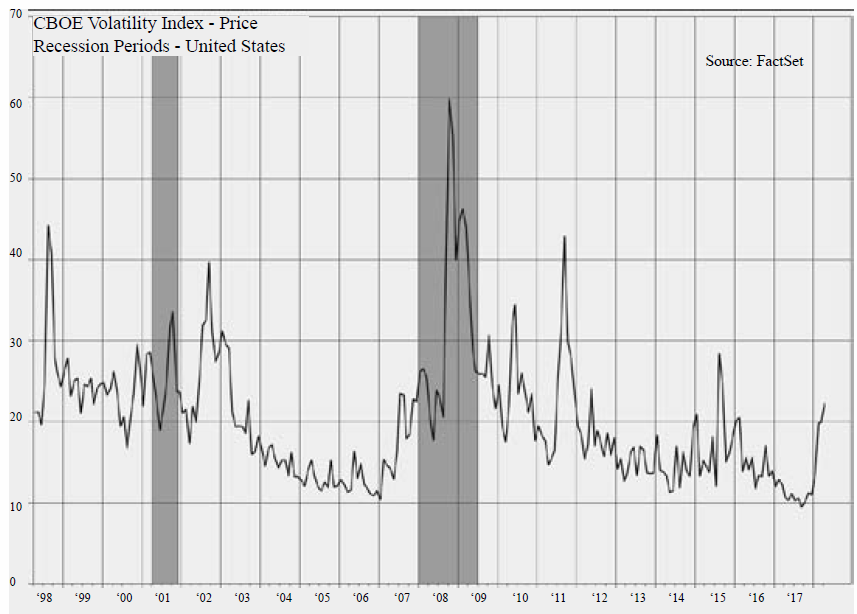
The intra-day and day-to-day market moves experienced this past December were extraordinary. While it is tempting to compartmentalize the various factors impacting the market, it is never as neatly demarcated as we like to think. We believe a portion of the heightened volatility can be attributed to the increased popularity of passive investing over the past decade, where a push of a button can instantly buy or sell a portfolio of securities with no consideration of valuation. Roughly 85% of the daily trading volume of the U.S. stock exchange is being attributed to machines, models, or passive investing formulas. When so much capital mirrors popular benchmarks, the buying and selling of securities can be described as a herd mentality.

Recently, the Federal Reserve also became an external factor from which the market closely took its cues. Late in the year the market had a brief, strong rally after Fed Chairman Jerome Powell hinted at reduced enthusiasm for interest rate increases in 2019, which was different from the forward guidance signaled from its September meeting. The Fed’s quarterly economic projections showed a median forecast of two rate hikes in 2019 (down from three in September). As the market digested the news and the Fed raised interest rates by 0.25% in December, the continued downdraft in the market was a signal from the investment community that perhaps there shouldn’t be any rate increases in 2019.

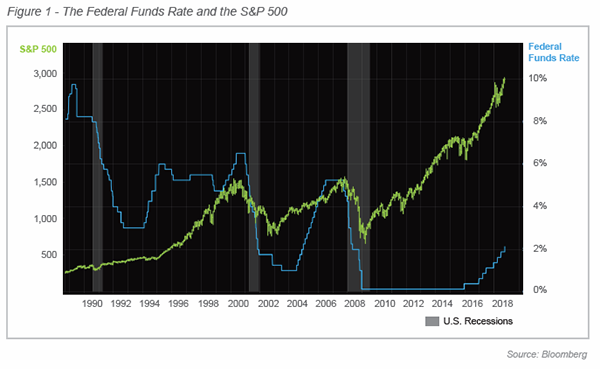
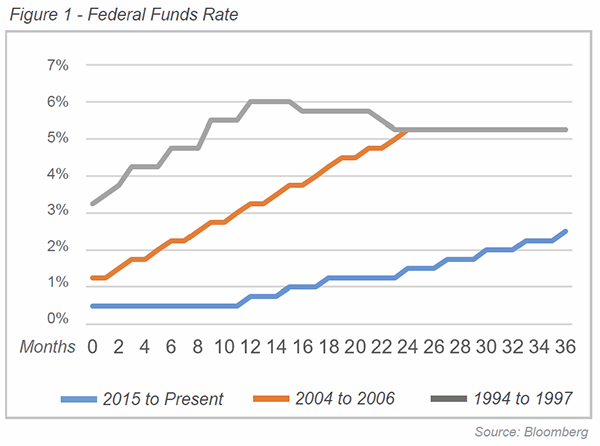
Compared to the last two tightening cycles (1994-97 and 2004-06) this Fed has made remarkably few rate increases. During the 1990s and 2000s, when Alan Greenspan served as Chair, the Fed was known for its “measured pace” of rate increases. In fact, during one 12-month period, the Fed raised short-term rates nine times in 0.25% increments. Compared to that period, the current rate of increases gives a whole new meaning to “watching paint dry”. As illustrated in Figure 1, this past December’s rate increase (the blue line) marks only the 9th increase in 36 months!

The goal of the Fed, in a growing economy that doesn’t require stimulus, is to achieve a “neutral rate” that neither spurs nor slows growth. The recent comments from the Fed seem to indicate that the neutral rate is lower than it used to be and could account for some of the slower pace, as smaller changes in the Federal Funds rate could have outsized effects.

Investors appear uncertain about how to adjust to the changing dynamics of the central banks’ role in the marketplace. After a decade of quantitative easing, when central banks throughout the world became a new “buyer” by implementing the novel crisis-response tool of purchasing assets from the public, they are now looking to exit the market. Over the past number of years, this new “buyer” helped the stock market rally and decreased the cost of credit. While the U.S. Fed began tapering its balance sheet (exiting the market as a buyer) in mid-2017, other central banks throughout the world were only starting to slow quantitative easing policies and to proceed down the path of quantitative tightening, although this process is expected to accelerate throughout 2019.

As we’ve noted in past newsletters, the Fed has admitted that the effects of years of quantitative easing, and now quantitative tightening, are largely unknown. While the decrease in the Fed’s balance sheet has been running for more than a year, the Fed has increased the dollar amount of securities that will roll off its portfolio this year to $150 billion a quarter, up from $30 billion a quarter when the process began. While it is difficult to isolate one underlying factor as the root cause of the recent market turmoil, one could ask, “If quantitative easing provided significant benefit to asset prices over the past decade, what costs will the opposite effect have?”

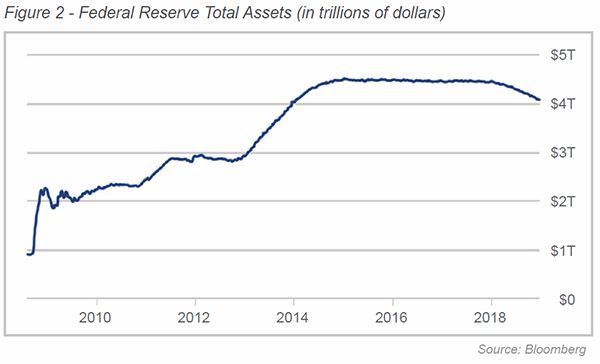
On this front, investors were seeking reassurance from Chairman Powell that the Fed would be responsive to balance sheet reductions in the future instead of stating that reductions were on “autopilot”. However, as illustrated in Figure 2 below, the deleveraging of the Fed balance sheet is proceeding just as quickly as the rate hikes have over past three years… a “glacial” pace. The Fed’s holdings have only fallen to $4.1 trillion from $4.5 trillion a year ago and are expected to drop to $3.6 trillion by the end of 2019. In addition to the U.S. central bank attempting to “normalize” its balance sheet, the European Central Bank (ECB) ended its own bond buying program in December, meaning the largest central banks’ balance sheets will decline next year for the first time this decade.

Meanwhile on the corporate front, U.S. companies diverted an increasing amount of their reduced tax burdens to shareholders in the form of dividends in 2018. As of November 2018, companies in the S&P 500 Index increased their dividends by 7.7% over the last year, paying out nearly $421 billion versus $391 billion in 2017. Goldman Sachs is predicting that 2019 dividends will increase by as much as 6%.

Even with this projected increase dividend payout, tax reform is allowing corporate America to put more cash into its coffers. As of mid-December the dividend-payout ratio for the S&P 500 Index was 33%, down from pre-corporate tax reform levels of 38%. 2018 also marked the all-time record for U.S. corporate stock buybacks. Approximately $800 billion of stock was bought back amid total announcements of $1.1 trillion. As with dividends likely to increase in 2019, the trend of stock buybacks is also likely to increase into 2019, assuming corporate America continues to generate significant free cash flow.

Companies will have to find other ways to provide earnings growth this year, following 2018’s one-time benefit, produced by the sweeping corporate tax cut. Analysts are estimating corporate earnings growth will drop by more than half in 2019, to 8.3% versus 21% in 2018. While the U.S. economy continues to give the appearance that all is well and the Fed estimates that the economy will grow at a rate above 2%, the market doesn’t share the same sentiment.

There are two critical factors impacting stock prices and the probability of positive returns for 2019 in our view — the condition of the global economy and the resolution of trade disputes. The first factor impacts companies’ ability to grow revenues, while the latter impacts their profitability by increasing costs. With the Brexit deadline fast approaching, China feeling the pain of a slower global economy, and Europe’s lackluster economy, global growth probably isn’t going to surprise on the upside in 2019. Meanwhile, the U.S. has given China until March 1st to avoid higher tariffs, by addressing complaints it discriminates against foreign companies and steals their technology. A resolution of this trade dispute could significantly boost stock market potential in 2019.

Interestingly, in spite of the concerns, issues, and volatility, a major global study by Schroders found U.S. investors expect their investment portfolios to return about 8.5% annually over the next 5 years. The study found that millennials, defined as those respondents between the ages of 18 and 36, believed they would get an annual return of 11% over this period. The S&P 500 has achieved an 11% return or better 22 times in the past 40 years, so it is definitely possible. However, the unknown is how this segment of the population, who have likely only experienced an investment environment where the Fed had its back, will handle negative returns for multiple years or if the market reflects a period similar to 2000 to 2009, that only beat the 11% expectation three times in 9 years.

With the increase in market volatility and late cycle prospects, it remains imperative to be aware of your surroundings but to not panic “high up in the tree”. The recent market action will allow patient investors an opportunity to capitalize on attractively-priced, financially-strong, and well-managed companies as the market indiscriminately throws the baby out with the bathwater.

Q3 2018 – “The Robust U.S Economy Carries On”

Q3 2018 – “The Robust U.S Economy Carries On”

For the past 10 years, world equity markets have been buoyed by unprecedented monetary policies adopted to kick start economies following the Global Financial Crisis of 2008. These “accommodating monetary” policies were intended to nudge economies to an inflection point where they achieved a self-sustaining upward growth trajectory. While most economies are seeing positive growth, albeit lower than expectations from early in the year, extraordinarily 25% of the world’s economies still have negative interest rates. Moreover, major central banks, with the exception of the U.S. Federal Reserve (the “Fed”), are currently putting $500 billion a month into the global financial system — hardly a backdrop that establishes confidence in a self-sustaining position for most of the world’s economies.

The Fed’s confidence in the robustness of the U.S. economy stands out from the world on multiple fronts. At its September meeting, the Fed continued towards its goal of “normalizing” interest rates by increasing the short-term Federal Funds rate to a range of 2.0% to 2.25%, a move which had been widely anticipated. This action marked the first time since 2008 that its benchmark rate hit 2.0% and surpassed the Fed’s measure of inflation. As illustrated in Figure 1 below, the accommodating policies keeping interest rates low and the quantitative easing (QE) the Fed has employed over the past decade, have been bullish for the U.S. stock market.

Fed guidance is for one more rate hike in 2018 (December), three in 2019, and one in 2020. Assuming all increases will be in 0.25% increments, the Fed Funds Rate would be between 3.25% to 3.5% by 2020, which is lower than where rates were prior to 2000.

The challenge facing the Fed is getting back to a level to ensure it has the capacity to lower rates in the event of a recession. As observed in the shaded portions of the chart representing the three recessions of the past 30 years, the subsequent lowering of the Fed Funds Rate was used to stabilize the economy. Notice that all recessions shown tend to follow a period of Fed Funds Rate tightening (rising rates). Therefore, the current challenge for the Fed is raising rates to a level that slows the economy to a sustained growth rate without tipping it into recession.

Additionally, the Fed has been attempting to “normalize” monetary policy by reducing its balance sheet by $40 billion a month and is expected to increase that reduction to $50 billion a month starting this October. The U.S. is the farthest along in normalizing its monetary policies, and most countries have not even started. However, the previously mentioned $500 billion per month that is being injected into the global financial system by major central banks outside the U.S. is expected to cease entirely by early next year.

Though Europe’s economic growth for this year and next has been lowered from earlier expectations, the European Central Bank (ECB) has committed to pressing ahead to phase out its $2.9 trillion bond buying program by the end of the year. The ECB expects to hold its benchmark interest rate at the record low of minus 0.4% at least through the summer of 2019.

March 29, 2019 marks the official date that the United Kingdom is set to leave the European Union, but there is no finalized withdrawal plan in place. If there is no deal by January 21, 2019, the British government must make a statement within five days on what the United Kingdom plans to do, according to the European Union (Withdrawal) Act of 2018.

Europe’s uncertainty heading into 2019 and the ongoing volley of tariffs and trade disputes could impact the Fed’s estimated trajectory of the U.S. economy. Although the tension between the U.S. and China continues, bilateral trade agreements are being completed with other countries.

Regardless of tariffs, it is unwise to underestimate American business ingenuity in resolving how to rectify roadblocks and optimize a solution to a problem. While certain industries, such as agriculture, could have significant difficulty recovering potential lost markets, most of Corporate America should be able to find working solutions within several years, if not sooner, if a prolonged trade dispute materializes. Unfortunately, consumers may see higher prices on certain items in the short-run, but given the strength in the economy, consumers are positioned relatively well.

With the low unemployment rate, the U.S. stock market at all-time highs, and wages finally starting to show some increase, the average consumer feels good. This positive sentiment is measured by the Consumer Confidence Index, which hit an 18-year high in September, as illustrated in Figure 2. With the holiday season quickly approaching, this is a positive indicator for consumer spending and could help the markets finish the year strong.

According to the Fed, the economy should continue to support consumer sentiment. Economic output is growing more than 50% faster than the Fed forecast a year ago, wages are accelerating, and labor markets are the strongest they’ve been in at least a generation.

Capital investment is strengthening and productivity is starting to show some improvement. Stock price valuations are high, although many traditional value stocks have failed to participate in the bull rally to the same extent as growth stocks. Credit is cheap and widely available, and inflation is running at or near the Fed’s target of 2.0%.

The disparity between growth stocks and value stocks is perhaps the most glaring factor that could impact investors’ portfolio performance over the next 18 months. The bull market of almost 10 years has not been as favorable to those investors positioned conservatively with bonds or stocks. With low interest rates, corporations have been able to borrow a significant amount of capital to fuel growth opportunities and return cash to shareholders in the form of stock buybacks and dividends. As interest rates ratchet up, investors could gravitate to more reasonably-valued investments and not seek risky assets for growth.

Wall Street analysts have a rosy picture of corporate profits over the next 3 to 5 years, forecasting earnings to increase at an annual rate of 16.5%. We view this estimate as too optimistic, and if expensive stocks that are priced at “beyond perfection” valuations prove unable to report better-than-expected earnings, the market will likely see a dramatic increase in volatility. While this could hurt the high-flying growth stocks, there are a number of investments with more reasonable valuations that could benefit from a rotation of capital. Value investors should be well-positioned in a rising interest rate environment, as low rates have favored riskier assets (growth stocks) over the past several years. That performance disparity will start to tighten if value stocks perform better than growth.

As U.S. companies celebrate the anniversary of the tax reform of late 2017 and the increased earnings growth it brought, there is a significant wildcard that could help the market continue to reach new highs, and that is any significant resolution in the trade spat with China. If that gets resolved, we expect this market to continue its upward trajectory.

Q2 2018 – “Bitcoin – A Global Currency or a Speculative Bubble?”

Q2 2018 – “Bitcoin – A Global Currency or a Speculative Bubble?”

Despite vast publicity in the media, very few people really understand Bitcoin. In this letter we will attempt to explain Bitcoin in simple, nontechnical terms. Also, we will explain why we think current Bitcoin market investors are riding a speculative wave that could soon collapse.

First, Bitcoin is not an actual coin as you see in some photographs and depictions in articles you may read. A Bitcoin is a digital token, with no physical presence, and no backing by any country’s central bank or government. Bitcoin can be sent electronically from one Bitcoin owner to another, anywhere in the world. A transaction takes place when a transfer of funds is initiated between the Bitcoin addresses of the sender and recipient. Addresses are heavily encrypted making the transactions anonymous.

Unlike centralized payment networks such as Visa or PayPal, which solely keep track of their users’ transactions and balances, the Bitcoin payment network is decentralized. All Bitcoin digital tokens are stored, moved and transactions are simultaneously verified across a massive (some 10,000) network of connected computers. The record keepers (known as miners) operating these computers continuously and independently update the chain of Bitcoin ownership. Each miner shares with all others something akin to a digital accounting ledger for all Bitcoin at that time. This system is known as Blockchain.

How is Bitcoin created? New Bitcoin is created as miners are paid in Bitcoin for their computer costs and services. The amount of Bitcoin growth per year is limited and pre-determined by the founder’s original design that there would be no more than 21 million total Bitcoin in circulation (some 17 million currently outstanding). Similar to the way the Federal Reserve prints new dollars out of thin air, new Bitcoin are also created artificially and distributed to miners via a speed and accuracy based lottery system (computer based) over time.

How do Bitcoins work? Bitcoins are essentially like having money stored in the cloud. This digital money is stored in wallets and you access the rights to them when you exchange Bitcoin addresses (see above) with vendors, individuals etc. Bitcoins can be purchased and sold online using a credit card from companies such as Coinbase.

In summary, the often written advantages of Bitcoin as a possible global currency include 1) the anonymity of transactions, 2) the speed and potential lower cost of transactions, 3) its global reach, and 4) the diversity and transparency of its Blockchain payment system.

Now let’s discuss the negatives and potential downfalls of Bitcoin, which we think are numerous relative to the US dollar. In our opinion some of the limiting factors to Bitcoin becoming a legitimate global currency include: 1) lack of market depth and liquidity, 2) lack of price stability (see graph), 3) numerous countries do not accept Bitcoin as a legal currency, 4) the majority of Bitcoin transaction value has gone toward speculative trading rather than commerce, 5) in a growing world economy it is impractical to cap the amount of global currency outstanding, and 6) in a security conscious world it makes no sense to favor a currency which can be moved across the globe anonymously.

In our view the ability of Bitcoin to unseat the US dollar as the world’s dominant currency is near zero in the medium term. Current statistics speak to the high degree of confidence in US dollar value and stability. Around $580 billion of US bills are used outside the country. That’s 65% of all dollars. More than 1/3 of global GDP comes from countries that peg their currencies to the dollar. More than 85% of forex trading involves the US dollar. 39% of the world’s debt is issued in US dollars. Finally, 64% of all Central Bank foreign exchange holdings are in US dollars.

Perhaps most important is the perceived value of the guarantee and backing of the dollar by the US government. Although the US completely severed its ties to the gold standard in the early 1970s, the US dollar is still backed by the full faith and credit guarantee of the US government. For many countries this would mean very little but US GDP has grown 44 out of the past 50 years. The S&P 500 Index has grown at a 10% per year pace over the same period. Tax revenue and government owned assets have grown substantially. Thus, the government backing is recognized globally as having real value.

Unlike the dollar and other country-backed currencies, Bitcoin has no government or asset backing whatsoever. While we acknowledge some of Bitcoin’s positives, we view there are far more negatives. So what is driving the price appreciation? We view it as a temporary situation driven by pure speculation. New buyers are entering the market simply because it is going up. This situation, like other bubbles, is not sustainable because Bitcoin has no real underlying value. As that reality sinks in traders are likely to take their losses and switch to other trading vehicles. If trading volume shrinks materially, the price of Bitcoin could drop to near zero.

Q1 2018 – “Market Volatility Returns”

Q1 2018 – “Market Volatility Returns”

The U.S. stock market started off in January with a bang, rallying to new records daily. However, in February volatility was reintroduced to investors at a level that has not been seen since 2015, as measured by the CBOE Volatility Index (VIX). After nearly nine years since the great financial crisis of 2008, the jitteriness of the aging bull market seemed to be looking for any excuse for a sell off, and the talk of a potential tariff war was enough to send the market down, with wide intra-day swings. With all of the excitement, the S&P 500 Index declined .8% during the quarter, which gave the impression of the market’s bark being worse than its bite. Nonetheless, this was the first time in the past ten quarters that the S&P 500 Index was negative for the quarter.

Three major cross currents are impacting the market currently: the rise in interest rates, 2017 tax reform, and the trade tariff talk. As was widely anticipated, The Federal Reserve (the Fed) raised their benchmark lending rate by a quarter of a percentage point in March (to a benchmark interest range of 1.5 – 1.75%). Additionally, the Fed indicated that they expect to raise rates another two times this year and then three times in 2019 (up from two previously) due to the strengthened economic outlook. Other short-term benchmark lending rates (such as LIBOR and Commercial Paper) have gone up more than half of a percentage point, due to anticipation of further interest rate increases and the beginning of dollar repatriation activity by U.S. companies due to the changes in the tax law.

The benchmark 10-year Treasury note experienced a slight increase in its yield, as inflation expectations remain modest, ending March 31st at 2.74% compared to 2.56% and 2.43% at the end of 2016 and 2017, respectively. With most of the rest of the world continuing to stay highly accommodative with their monetary policies (quantitative easing programs artificially keeping interest rates low in their economies), it helps put a ceiling on interest rates as U.S. interest rates look relatively attractive compared to the yield on other nation’s sovereign bonds. During February, foreign investors bought the largest amount of Treasury notes and bonds through U.S. government debt auctions since May 2016.

The number of Treasuries held for foreign central banks by the Federal Reserve has climbed to a record $3.1 trillion in March and is up 7% from a year ago. As the Fed continues to raise its benchmark rate during the year, there will likely be upward pressure on longer-term rates. Nonetheless, as the yield curve chart illustrates below, as short-term rates have increased, the longer term rates on the yield curve have flattened, as investors are either anticipating that the economy will not be as robust (rise in the short rates will lead to a recession), inflation remains under control, a trade war that could hinder economic growth, foreign quantitative easing will continue beyond the fall, a safety haven has occurred given recent market volatility, or a combination of all the above.

U.S. companies communicated on their year-end calls the benefit of the recent tax reform with increased profitability as a result of the permanent reduction of the corporate tax rate from 35% to 21%, leading to a positive earnings growth outlook for 2018. As the dust settled, investors were left contemplating whether lowering the corporate tax rate would have more than a one-time positive impact, or just a positive impact on 2018 earnings growth. This uncertainty could perhaps be some of the cause for the stocks retreating in February, but we believe that the corporate tax reform will put U.S. companies in a better competitive position within the global economy well into the future.

From a 30,000 foot view, corporate tax reform was the first step in positioning Corporate America on a level playing field in the global marketplace from a tax perspective. Naturally, the next step would be to position Corporate America on a more level playing field in the global markets from a trade perspective, and that is where the recent tariff talks come into play. Before commenting on potential trade war scenarios, it is best to understand the current instigator of the trade talks, President Trump, who is unquestionably a businessman before a politician, and as so his strength is in negotiating deals, not diplomacy.

In Negotiating 101, successful negotiations start by knowing what leverage can be brought to the table, and for President Trump, the United States economy (the largest in the world) gives him the upper hand in negotiations. When compared to the second largest economy, China, which claimed a gross domestic product (GDP) of $12.8 trillion in 2017, the United States’ GDP topped $19.3 trillion in the same year. Countries that have a high percentage of their GDP derived from exports tend to be more negatively impacted by trade tariffs. According to the 2016 World Bank figures, global exports made up 29% of global GDP. For China, 20% of its GDP was dependent on exports. By comparison, exports make up 12% of the U.S. GDP.

For years the media has reported the wide trade imbalances the U.S. has with the rest of the world, a problem that comes naturally to the largest importing economy in the world. In 2016, China’s exports to the U.S. were worth $386 billion, while its imports from the U.S. were worth only $135 billion. In a trade war, this trade surplus would become a weakness for China and something that both sides should understand. China derives about 3% of its GDP from exports to the United States, while the United States derives around 0.5% of its GDP from exports to China.

While a return to a 1930’s style global trade is undesirable and would leave no economy unscathed, we believe so far, that the tariff talk is nothing other than utilizing the world’s biggest economy as leverage to lower trade barriers with other countries. The effective start date for the tariffs have not been announced from both the United States and China. Currently, free trade is a misnomer in many industries, and many countries, including the U.S., which impose tariffs on certain imported products already. The theft of intellectual property and trade secrets in China is no secret among the business and investment communities throughout the world, where knock-offs of the world’s leading brands can be commonly found on the streets of China or mandatory technology transfers are required by companies wishing to do business in China. Any trade reform with China will be positive for Corporate America, and we believe that successful negotiations will be the result of the recent verbal volley back and forth between multiple trade partners.

We believe this short-term volatility is just the beginning and could intensify as other central banks reduce their easy money policies and return to a more normalized environment. The last time the S&P 500 was up over 5% in the month of January and finished negative for the quarter was in 1980. While there were different factors impacting the market at that time, such as double-digit inflation, mortgage rates in the high teens, etc., it was a time of great uncertainty, and financial markets are particularly adverse to uncertainty. Regardless, the market finished up 31.7% for that year. The object lesson here is not to overreact to the short-term events, particularly with the sensationalism of the current media coverage jumping from one crisis to the next but remain focused on long-term financial goals. The current economy is in a much better position than the doomsayers would lead you to believe.