Q4 2021 – “Can the Federal Reserve ‘Thread the Needle’ With Interest Rates?”
Q4 2021 – “Can the Federal Reserve ‘Thread the Needle’ With Interest Rates?”
Download newsletter in PDF format
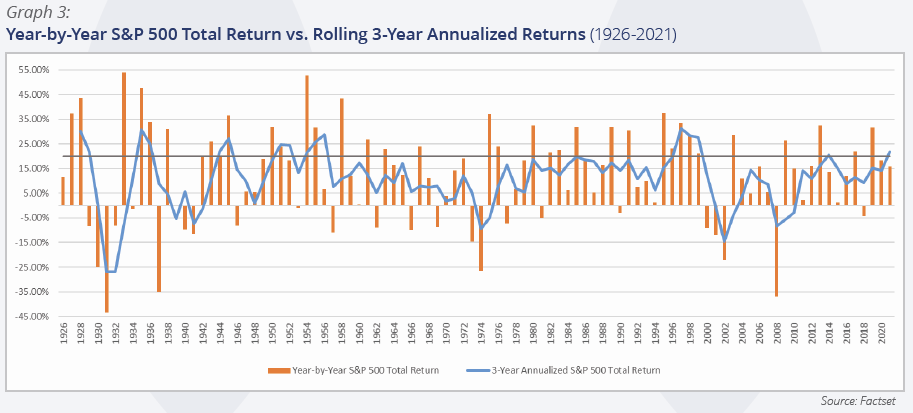
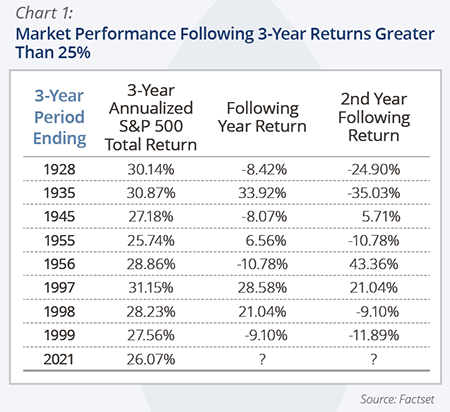
The total return for the S&P 500 was 28.71% in 2021, bringing the 3-year annualized return for 2019-2021 to 26.07%, the eighth highest such compounded return since 1926. As illustrated in our last newsletter, it is rare for this 3-year annualized rate to track above 25% for consecutive years, though not unprecedented. The only past instances were when it occurred in 1955-1956 and when it happened three years in a row from 1997-1999 during the “dot com” technology bubble. Chart 1 shows the market performance in the two years following the other historical instances of 3-year annualized return periods of greater than 25% returns. The record is mixed, but some correction or at least normalization of returns has typically occurred within the following couple of years.
While this data suggests a cautious approach may be warranted, there have been instances of strong returns continuing, albeit at less robust levels. There have also been numerous streaks of positive index total returns of 5 consecutive years or more, including from 1947-1952, 1982-1989, and from 1991-1999. Indeed, the market was up in 16 of 17 years from 1982 through 1999; and in 1990, the only down year in the period, it was down just (3.1%). Moreover, it is rare for 3-year annualized returns to be negative, making the decision to time an exit and subsequent re-entry from/into the equity market highly dubious. The only times this has happened since 1926 were: 1930-1933 during the Great Depression; in 1939 and from 1941-1942 at the outset and during World War II; from 1974-1975 when inflation spiked as a result of the OPEC oil embargo; from 2001-2003 as the tech bubble burst; and 2008-2010 during the financial crisis.
Given these occurrences happened during such noteworthy periods in history, we need to consider the current circumstances more specifically before we become resigned to a correction. In fact, there are numerous reasons to expect the market can continue to rise.
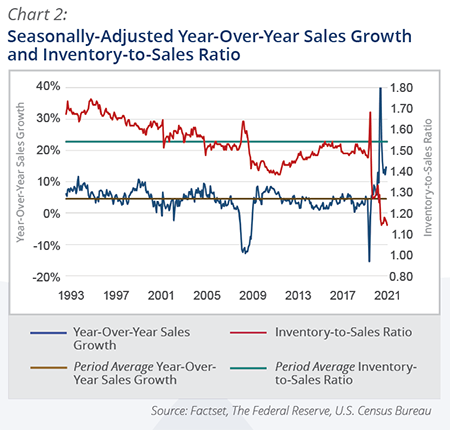
On the positive side, consumer demand is very strong. Chart 2 shows that seasonally adjusted year-over-year U.S. retail sales growth is still significantly higher, and inventories relative to retail sales much lower compared to average levels. The data suggests strong economic activity will continue as inventories are replenished to historical norms relative to sales.
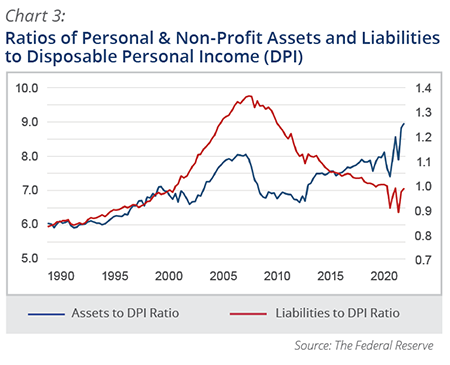
Moreover, personal and non-profit balance sheets (the Federal Reserve combines them in their reports, as distinct from businesses) are as strong as they have ever been on a number of key metrics. The ratio of total assets to liabilities, at above 9 times, is the highest it has ever been.
The positive wealth effect from strong stock market performance has brought financial assets as a percent of total assets close to all-time highs (>70%). Finally, with respect to balance sheet strength, Chart 3 shows that the ratio of assets to disposable personal income (DPI) is at an all-time high of almost 9 times, whereas liabilities to DPI are at close to multi-year lows at just over 1. Such balance sheet strength, coupled with pent up demand suggests that consumer demand is likely to remain strong moving into and throughout 2022.
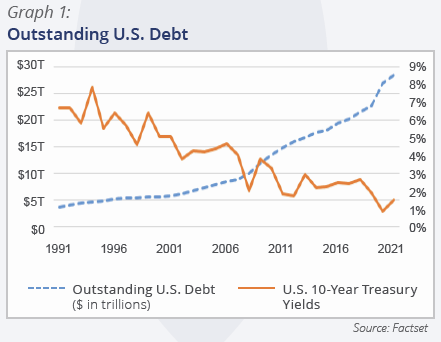
Other positives for stocks are the historically low real (i.e., adjusted for inflation) interest rates, which make bonds comparatively less attractive than in the past, and the strong cash flows being generated by companies, which has led to higher dividend payments to investors and share buybacks that reduce share counts outstanding and so earnings per share. Our expectations over the last year for higher interest rates have been partially correct; interest rates have indeed moved higher across the maturity curve since the end of last year, but rates have increased more for shorter maturities than longer maturities than we expected, leading to a flatter yield curve (though it has lately begun to steepen again). The prospect of higher interest rates remains, as the Federal Reserve (the Fed) finds itself needing to combat the inflationary effects confronting the economy. We believe the prospect of continued or worsening inflation is the biggest risk to the market and understanding the causes and likely actions by the Fed to combat it is critical.
Inflation can most simply be thought of as rising prices or, alternatively, too much money chasing too few goods and services. These are really two sides of the same coin, and history shows that prices and money supply generally move together. Money supply spiked sharply at the outset of the pandemic and the Consumer Price Index (CPI) predictably followed; both remain well above recent averages. The money supply growth has been a consequence of both extraordinary monetary policy by the Fed and unprecedented levels of fiscal spending by the federal government.
On monetary policy, the Fed lowered overnight lending rates to virtually zero to spur economic growth. Simultaneously, as documented in recent newsletters, the Fed has been aggressively buying both Treasury and mortgage-related securities in the open market, which has the effect of leaving the dollars they purchase the securities with in the economy. The Fed has begun tapering such purchases and plans to complete them sometime in the spring. More significantly, the Fed has also signaled that it will likely increase the Fed Funds rate (i.e., overnight lending rate target) during 2022 to dampen the inflationary pressures in the economy. Not replacing maturing bonds it has bought would also help accomplish that.
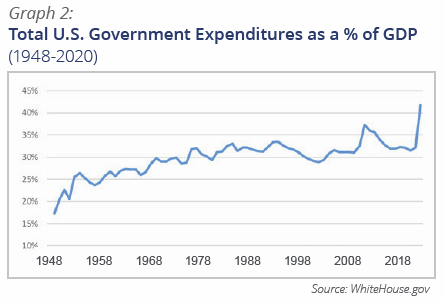
Stimulus measures taken by the government to boost the economy and assist people during the pandemic have had a similar effect on money supply, and the additional disposable income has contributed to boosting demand. The last such bill to be enacted was the bipartisan infrastructure bill. It remains to be seen if the “Build Back Better” bill will be passed, and whether it will be further diluted. Beyond that possibility, it is unlikely that another significant spending bill will be passed before this year’s midterm elections. And if the historical trend of the incumbent president’s party losing seats repeats, Democrats could lose their slim majority in at least one legislative chamber, making more outsized fiscal stimulus unlikely through 2024. This also would help to ease inflationary pressures.
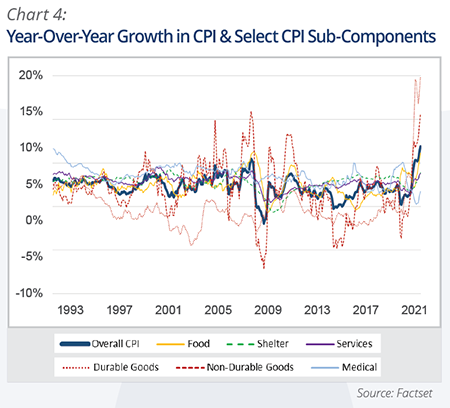
The pandemic led to relatively strong increases in demand for goods and a corresponding decline in demand for services, especially for travel and restaurant and other experiential outlets, given the lockdown and peoples’ inclination to stay home for safety. The additional time at home led to greater demand for electronic devices, groceries, goods such as furnishings, and also new homes (if people were going to be spending more time at home, they wanted it to be more comfortable), as well as certain services such as streaming, gaming, and other at-home services. The relative shift to goods presented challenges for the manufacturers of those goods given the COVID-induced worker absences; these occurred at both the final manufacturing businesses and also at the manufacturers of the parts and raw materials that supply them. The most notable and widely reported of these was the impact of constrained semiconductor supplies on the auto industry, which led to significant curtailment of new car production, but other examples abound. Such inflationary pressures for goods continues. Chart 4 shows how CPI sub-categories for goods and food have moved from growing below overall CPI growth most of the past 8 years to above or in-line, whereas categories such as shelter, medical, and services have moved from tracking above to below the overall trend, which is the boldest dark line. (The energy price sub-component is omitted because it would literally be off the high-end of the chart.)
Higher commodity prices have contributed to the inflationary pressures. However, commodity price increases tend to reverse themselves as higher prices induce increased production and so supply, thus bringing prices down given stable demand. This works in reverse, too, as prices that are too low lead to lower investment, supply and eventually higher prices. Of all the commodities, the most important is energy given it is a key input in both the manufacturing and delivery processes for both hard and soft goods. We believe oil market prices will remain firm in the coming years given the underinvestment by the industry over the past number of years, in part because of onerous regulations and other prohibitions, as the current administration (and many governments around the world) attempt to transition the economy towards the use of renewable energy sources. The higher resulting prices for fossil fuels theoretically incentivizes this transition, but also contributes to inflation. However, renewable substitutes are not abundant or reliable enough to meet demand yet, nor is the related electricity-generation and supporting infrastructure. Policies meant to curtail U.S. oil and gas production do not change worldwide demand levels, and increased reliance on OPEC+ nations such as Saudi Arabia and Russia to meet demand represent an economic and national security risk. Plus, the transport of those supplies across the Atlantic Ocean increases greenhouse gas emissions compared to them being produced in the U.S., where emission-related regulations are more stringent.
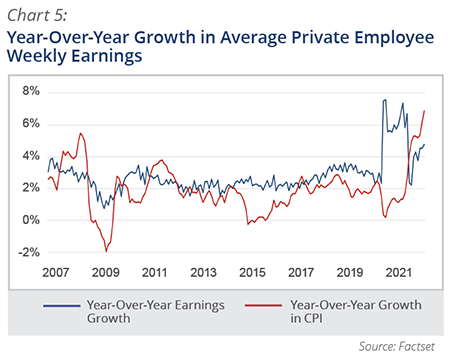
Beyond energy input prices, the other most significant inflationary cost pressure is labor. Unlike commodities historically, wage increases tend to be stickier as raises are seldom reversed. The labor market has tightened considerably since the beginning of pandemic shock, with the unemployment rate now at 4.2%, approaching pre-pandemic lows, and a historically low labor force participation rate of <62%, levels last seen in the 1970’s. In combination, this suggests the labor market will remain tight in 2022. Chart 5 shows the consequent record high levels of year-over-growth in average private employee weekly earnings, but also that those wage gains have been trailing the inflation rate since last spring.
Ultimately, the key question for the market this year is how effectively the Fed will be able to manage the inflationary impacts described above. There is risk to the stock market on both sides, and the pressure is on for the Fed to “thread the needle” on rates. If the Fed is too lax, inflation will become worse, with longer-dated bond yields moving higher and potentially inhibiting investment and growth. If they move too aggressively to squelch inflation, short-term rates will go up but longer-term rates will remain subdued. Higher rates would be applied to future earnings of companies, thus leading to lower present values (and so stock prices); this would likely be more acute for higher growth stocks with more earnings growth in the future. We believe the Fed will manage the situation prudently and that inflation will remain historically high but manageable. Such a scenario will accrue benefit to the companies we invest in, which we believe have products that are in demand and which should have the ability to increase prices to maintain margins.
While the risks are greater than they have been, we believe KCM’s approach to investing in high quality companies that can succeed throughout economic cycles will accrue benefit to our clients, whom we once again thank for their trust in us to manage their investments.
~ KCM Portfolio Management Team ~