Q4 2017 – “Expect More of the Same in 2018″

Q4 2017 – “Expect More of the Same in 2018″

Investors throughout the world had much to cheer this past New Year’s celebration, as positive returns were experienced by investors throughout all markets. Stocks in the U.S. had their best year since 2013 as the S&P 500 Index returned 21.8% with December marking 14 consecutive months of positive returns, a feat not achieved since 1970. Strong performance was not confined to the U.S. as most of the major global equity markets posted double-digit returns as well.

Fixed income investors also enjoyed another positive year. While total returns for fixed income investments were not as high as those achieved in 2016, the market was significantly less volatile and the high yield market did not experience any significant sell-offs throughout 2017. It was another year where investors ventured out on the risk spectrum in pursuit of higher yields, and as a result lower credit quality “riskier” bonds outperformed higher credit quality “safer” bonds during the period.

One of the rare tailwinds that provided momentum for investors was that all of the world’s biggest economies experienced growth at the same time, a phenomenon described by economists as “synchronized global growth”, which continues today. In spite of the numerous geopolitical issues facing the world last year, nearly all regions had positive economic growth in a low inflationary environment, which we believe will provide a good backdrop for investors in 2018.

While healthcare reform in the U.S. remained elusive last year, Congress was successful in passing tax reform that should place U.S. companies in a better competitive position within the global economy. Over the past 30 years almost every developed country, with the exception of the U.S., had cut its corporate tax rate to attract investment. U.S.-based companies were increasingly disadvantaged by our domestic corporate tax policy and therefore many sought to reincorporate in low-tax countries in order to compete more effectively in the global marketplace. With the permanent reduction of the corporate tax rate from 35% to 21%, suddenly the world’s biggest economy has a tax policy similar to other developed economies. This is great news for the market. Additionally, a provision of the tax overhaul will allow U.S. companies to bring back cash that has been parked overseas to avoid higher taxes with a lower one-time cut for repatriation of earnings and cash. While U.S. companies have nearly $3 trillion in cash held overseas, it is estimated that nearly $400 billion could be brought back to the U.S. in 2018. While some countries are nervous about how a lower U.S. corporate tax rate could affect their respective attractiveness to investment capital, the entire world should benefit when the world’s largest economy is healthy. While tax reform aids Corporate America to the greatest extent, most individuals will benefit from lower taxes as well, but only temporarily as the reductions are scheduled to phase out after 2025.

In addition to the tax cuts, deregulation has been a significant priority of the Trump Administration, as the regulatory state is rolling back at a pace faster than even Ronald Reagan achieved during his Presidency. This follows years of expanding regulatory burden, with President Obama presiding over six of the seven highest annual page count increases to the Federal Register, where new regulatory rules are published. While it is difficult to fully understand the impact that the past decade of regulatory expansion has had on businesses, the Trump Administration projected that regulation took a $1.9 trillion annual toll on the economy in 2016. For Corporate America, there is a lot to look forward to in 2018.

The employment picture continues to strengthen with the economy posting a record 87 consecutive months of job growth and an unemployment rate of only 4.1%, a 17-year low. Consumer confidence is high which promotes an environment where consumers are willing to spend. Evidence of that was confirmed late December, when Mastercard reported that this past holiday season was the largest year-over-year increase since 2011 and set a new record for total dollars spent. Since consumer spending accounts for 2/3 of the U.S. economy, a healthy consumer and increasing sentiment should help economic expansion continue throughout 2018.

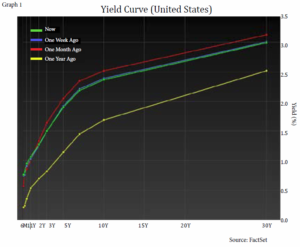
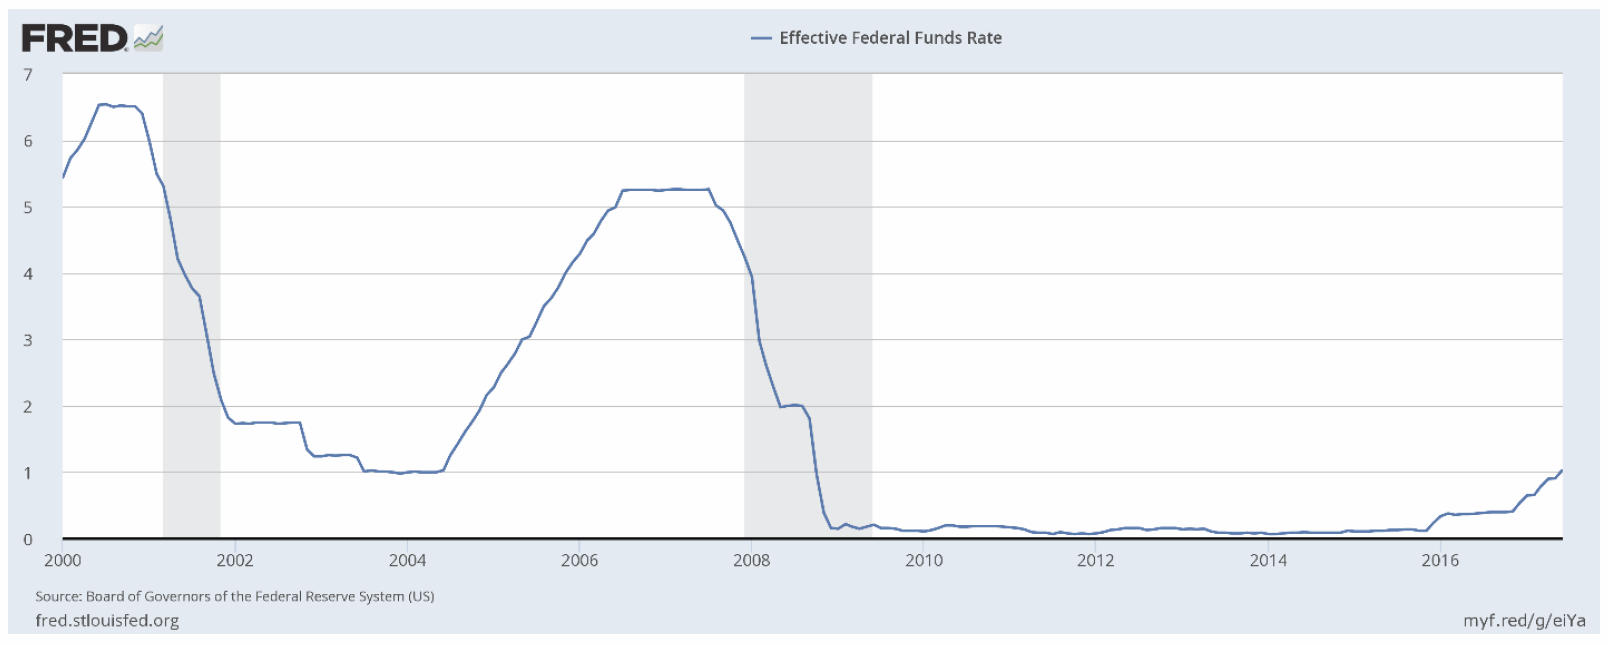
Long-term interest rates have remained subdued even with the Fed’s three short-term rate increases in 2017. The result has been a flattening of the yield curve over the past year where short-term rates have risen while long-term rates moved downward. For example, the 10-Year Treasury note, a common measure of long-term rates, yielded 2.56% at the end of 2016 but finished 2017 lower at 2.43%. Most forecasts anticipate three rate increases by the Fed this year, but if the economy starts to show signs of overheating the Fed may be forced to raise rates at a greater frequency, which could pressure stocks as investors sell riskier assets and gravitate towards higher yielding fixed income securities.

While yield spreads for non-investment grade bonds offer little room for error, in our opinion, the high yield asset class could deliver low to mid-single digit returns in 2018 due to continued strength in underlying business fundamentals and corporate tax reform, which should improve credit metrics and keep default rates low. We believe corporate high yield bonds offer a more favorable risk/reward profile relative to certain other traditional fixed income investments (e.g., Treasuries and other government bonds). Higher coupon rates and lower interest rate sensitivity characteristics (duration) of high yield corporate bonds provide some buffer to potentially mitigate the eroding effect higher interest rates have on traditional fixed income securities. The primary headwind for corporate credit is that current yields have already discounted some of this good news. We continue to favor high yield bonds on the higher-end of the credit quality spectrum and bonds with shorter maturities, both of which are less sensitive to interest rate movements.

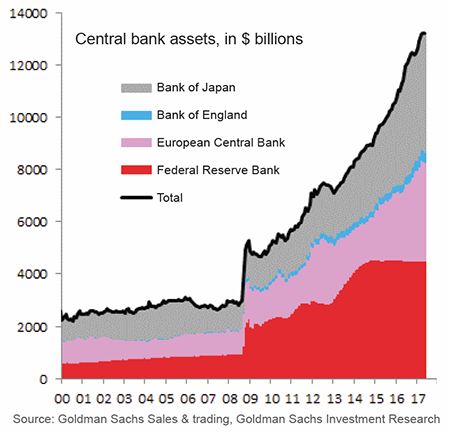
As global economy enters 2018, it is likely that more of the world’s central banks will start to unwind the extreme stimulus measures that have been in place for nearly the past decade. This process is already under way in the U.S.; however the central banks in Europe have been reluctant to follow, thus far, despite the world’s synchronized economic expansion. Even as economists in Europe have increased that region’s economic growth expectations for 2018, the European Central Bank (ECB) plans to continue injecting $35.5 billion into the economy each month through its current quantitative easing program. ECB’s economists projected in December that the eurozone’s economy will grow 2.3% in 2018, a big increase from the 1.8% growth projected as recently as this past September.

A final thought that investors should consider with their investments as we look out into 2018 centers around the passive versus active management debate, or “indexing” trend that continues to garner media attention. Last year marked the conclusion of Warren Buffet’s bet that hedge funds would underperform an S&P 500 Index fund over a 10-year period. He won and hedge funds lost. While it makes great fodder for the media, this bet had multiple problems when used as evidence for comparing active management vs. passive investing. For starters, hedge funds are not traditional investment vehicles one should think of as active management. High minimum investment amounts, a lack of liquidity lock-up periods which tie up investor capital for years combined with complicated and often murky investment strategies make most hedge funds unsuitable for the typical Main Street investor. The result of this 10-year bet detracts from the debate of whether or not traditional actively management strategies (e.g., mutual funds or private client individual investment strategies) are value creators when compared to index funds and ETFs.

What you won’t see communicated in articles written about the brilliance of Warren’s bet is that Berkshire Hathaway (ticker BRK.A or BRK.B), the multi-national conglomerate holding company that he leads at the helm, also did not beat the Vanguard 500 Index Fund that he selected for the hedge fund bet. Surely he isn’t advocating that Berkshire shareholders sell their stock and invest in an index fund.

According to our analysis using the eVestment database, the most popular repository of fund and institutional investment strategies available to U.S. investors, approximately $2.4 trillion dollars is currently invested in passive index products that are designed to track the S&P 500 Index. That is a significant amount of wealth that is guaranteed to underperform the benchmark 100% of the time (net of fees). Recall that while passive investing is lower cost, it isn’t free which guarantees a return below the S&P 500. We believe a significant portion of the passive investing movement has been driven by certain financial advisors and “robo advisor” programs that are charging their own fee of 1% or more on assets. This management fee is in addition to the investment expense deducted by the underlying index fund. We note that in 2017, almost 50% of U.S. active equity mutual funds beat their benchmarks, after fees according to data compiled by Credit Suisse. Independent investment research firm, Morningstar, makes it relatively easy to compare mutual funds to the S&P 500 on their website (www.morningstar.com). The results may surprise you. Active management isn’t nearly a value-detractor as portrayed in the media. Finally, the majority of equity funds created by, and managed by, Kornitzer Capital Management have outperformed the S&P 500 Index over the past 10 years, net of fees.

Q3 2017 – “Interest Rates & the Federal Reserve”

Q3 2017 – “Interest Rates & the Federal Reserve”

The equity markets continued their upward trajectory during the third quarter, with most market indices closing the quarter at an all-time high, or close to their record highs. This defies the well-known trading adage of “sell in May and go away” that warns investors to sell their equity holdings in May to avoid the typical volatile months of the summer and come back in the Fall. The Standard and Poor’s 500 (S&P 500) rose nearly 4% for the quarter, marking its eighth straight quarter of positive gains. The Russell 2000 was up 5.67%, its sixth consecutive positive quarter. It is noteworthy that there have been only five other times since 1980 when the Russell 2000 had positive returns in the first three quarters of the year.

Not only did the markets continue upward but it was also the least volatile third quarter as measured by the CBOE Volatility Index (VIX) for the past 20 years and was the lowest volatile quarter since fourth quarter of 2006 (see chart below). Emerging market stocks had a strong quarter and are on pace for their best year since 2009. While the Federal Reserve (The Fed) has raised their benchmark lending rate two times this year so far, with another increase expected in December (for a total increase of 75 basis points for the year), the rise in short term interest rates had minimal impact on long term rates, with the 10-year treasuries trading in a narrow range of 2.20 – 2.40% for much of the year, as signs of inflation continue to remain elusive.

Chart: Average Quarterly CBOE Volatility Index


Chart source: Factset

In a recent speech, Federal Reserve Chairwoman Janet Yellen defended the central bank’s projection for a gradual path of rate increases over the next few years despite the past few months of unexpectedly low inflation, which under the Fed’s preferred measure has undershot the central bank’s 2% target for much of the past five years. Although Chairwoman Yellen said she expects inflation to gradually move up to the target, she acknowledged the uncertainty surrounding that prediction and some members on the central bank committee disagree. Some policy makers are starting to be of the opinion that weaker inflation reflects structural changes in the economy rather than a temporary phenomenon. The sole opposing vote of the central bank’s two rate increases this year has been the Federal Reserve Bank of Minneapolis President Neel Kashkari.

Mr. Kashkari was closely involved in damping the initial stages of the financial crisis in early 2008 by working closely with then Secretary of the Treasury Henry Paulson and eventually being appointed to lead the Troubled Asset Relief Program (TARP), the initial Federal asset buying program to purchase $700 billion of the outstanding mortgages held by financial institutions. He believes that the raising of short term rates should be delayed until the inflation rate actually hits the 2% level on a 12-month basis.

Income reliant investors continue to be hopeful that interest rates will rise. Yields did soar into the end of 2016, as investors anticipated that President Trump’s pro-growth agenda would drive inflation and economic growth higher, giving the Fed a foundation on returning to a more “normalized” interest-rate environment, but since then there has been minimal movement of interest rates. The Fed has raised rates four times since 2015 and has penciled in one more rate increase this year (likely December) and three increases in 2018.

Why is it taking so long for interest rates to increase? From a monetary policy perspective, moving too quickly could slow growth unnecessarily, but raising rates too gradually could create an inflationary problem down the road that might be difficult to overcome without triggering a recession. Additional global forces are impacting the market. While the U.S. central bank is discussing returning to “normalized” levels, the rest of the world’s central banks continue to buy assets, and investors continue to seek yield throughout the world, and U.S. yields continue to be attractive worldwide.

During the September Fed meeting, policy makers dropped their average prediction for long-run interest rates from 3% to 2.8%. The long-run neutral rate of interest, the natural rate, has a big influence on how policy makers set rates. It is the rate that should keep inflation steady when the economy is running at full capacity and is key to judging monetary policy. The further rates are below it, the more they boost the economy. And once they reach it, monetary stimulus has been fully withdrawn. Recall that the fed funds rate was 5.25% in August 2007, significantly higher than today’s 1% to 1.25% range. In this environment, equities should continue to benefit into the foreseeable future, but there is another force that should be a positive driver of equities and the economy: the potential of tax reform.

Given Congress’ inability to pass legislation this year, the hit rate of proposed legislation becoming law this year does not inspire confidence, but there is time for Congress to deliver on the Republican promise of a simpler tax code with lower rates, but time is vanishing to accomplish it in 2017. The 1981 tax cut laid the foundation for a quarter-century of strong, noninflationary growth, which, despite three subsequent recessions, averaged 3.4%. The framework of the proposed tax reform would lower taxes on corporate profits, give incentives for business investment, and fewer and lower individual income tax brackets and the end of estate taxes. Under the Republican’s plan, the corporate tax rate would fall to 20% from 35% and the top rate on individuals could drop to 35% from 39.6%. As with any proposal in a divided congress, what is proposed and what actually becomes law will be vastly different.

A significant stumbling block for the proposed tax reform would be that it eliminates state and local tax deductions, placing high tax states’ citizens at a disadvantage. The elimination of the deduction was to help pay for the tax cuts by generating $1 trillion over the next 10 years. While it comes as a surprise, this isn’t the first time that the elimination of the deduction has been proposed. It was proposed in 1986, the last time that Congress revamped the tax code and failed to gain support from high-taxed states. But if it is removed, there will have to be changes elsewhere to help offset the corporate tax cut.

The most important news is that the plan would make U.S. businesses more competitive around the globe. The corporate rate, which is currently 35% and the highest in the developed world, would fall to 20%. While short of candidate Trump’s campaign platform of a corporate tax rate of 15%, it is below the industrialized world’s 22.5% average. This will be the first significant fiscal policy that could provide a tailwind to the equities market and the economy since the start of the financial crisis and importantly offset the increase in rising interest rates and the steps that the Fed is taking to reduce its balance sheet.

There are two key events that will take place over the coming year that will likely have an impact on the market. The first is that the Fed will begin to shrink its $4.5 trillion bond portfolio in October in an effort to bring it into alignment with levels prior to the financial crisis. The Fed’s balance sheet was less than $1 trillion before the 2008 financial panic. The central bank will be pulling $10 billion a month from the financial system and increasing that amount gradually over time. In a year, the anticipated monthly amount will be up to $50 billion, a level that is more than the Fed bought each month during the first phase of QE3 in 2013.

The three quantitative easing programs injected capital into the economy and kept rates low, while increasing the central bank’s balance sheet. Conversely, when the central bank sells or redeems those securities, the cash it receives is withdrawn from the economy, and in theory increases rates. We believe the attractiveness of U.S. yields relative to global alternatives will help support lower yields initially. But if multiple central banks throughout the world embark on drawing down their balance sheet in the same manner as the U.S., interest rates could be pressured to go higher. Nonetheless, currently the U.S. is the only central bank with a tightening policy.

It is debatable to quantify succinctly the impact of the QE programs to the economy over the past decade. After spending $2 trillion on government bonds in an effort to stimulate the economy, there is still uncertainty on how, or even if, it worked. Fed Chairwoman Janet Yellen has admitted that quantitative easing is still poorly understood even by the experts. Therefore, this monetary experiment is far from over and will likely continue to play out over the next several decades, not only in the U.S., but also in the world.

The second item facing the Fed is the potential for a leadership shake-up next year. Chairwoman Yellen closes in on the final months of her four-year term as the leader of the U.S. central bank and while she is a top contender for another term as Fed chair, President Trump has voiced that there are additional candidates that he is considering. Chairwoman Yellen has been very transparent with the market on the pace of rate increases and deleveraging of the central bank’s balance sheet, and any change in the committee makeup, particularly with the Chair position could have an impact on the policies currently expected by investors.

Inevitably, there will be geopolitical issues impacting the market, such as North Korea and Spain, but we believe they are transient to the marketplace. Not to downplay the seriousness of those events, because as the news flow ebbs to and fro, it will have an impact to the market. We just do not believe they will have a lasting impact to the U.S. economy and market.

So far, the current economic expansion has lasted 101 months (beginning in June 2009). The National Bureau of Economic Research shows only two U.S. expansions that lasted longer than this one. The great expansion of the 1960s went on for 106 months and a 120 month expansion that went from 1991 to 2001. To top that longest expansion, the current recovery would have to continue growing past June 2019. The most common cause of U.S. recessions in the postwar era has been monetary tightening by the Federal Reserve as a means to fight inflation, an issue that is non-existent today.

Historically, the fourth quarter is the strongest return quarter of the year and has a positive return nearly 75% of the time since 1980. With the underlying momentum driving the U.S. economy, the equity market should continue to perform well for the rest of the year. We continue to find value in the marketplace and would advise clients to continue to take advantage of any market pullback to put additional capital to work.

Q2 2017 – “Outlook for the Remainder of 2017″

Q2 2017 – “Outlook for the Remainder of 2017″

With the momentum in the market carrying over from the first quarter, the first half of 2017 has been the best start for global equities since 1998. Although equity markets outside of the United States were up more, the Standard and Poor’s 500 (S&P 500) had its best first half of the year since 2013. International markets performed well as confidence in economic recoveries around the world have been gaining or surpassing growth in the US. While there were pullbacks in the marketplace during the quarter, the market continued to bounce back with the S&P 500 setting 24 new closing records.

The world economy continues to strengthen. In early July, the first quarter Gross Domestic Product was revised upward to 1.4%, better than initial expectations. The US job market continues to be strong, adding 222,000 new positions in June, and the unemployment rate at 4.4%. The recent Labor Department report also showed that there were 6 million unfilled job openings as of the end of April, the most since it started keeping track in 2000. While the employment picture looks bright, wage growth has only been modest, possibly held down by the weak pace of productivity growth in recent years.

Throughout the world, economies have been recovering and central banks have been contemplating normalizing their balance sheets. This has had a negative impact on the dollar, as it suffered its worst stretch in six years during the first half of 2017, beginning down 5.6% year-to-date against a basket of major currencies, distinguishing the greenback as the worst performing among the major currencies. However, a weaker dollar will actually help US multi-international companies with international sales, as prices on US products become more competitive in the foreign market, further helping the US economy.

Nonetheless, putting the recent decline of the dollar into proper context, this past November the dollar was at a 14-year high right after the US presidential election as the pro-growth platform that President Trump outlined in his presidency bid excited investors on the prospects of strong economic growth and higher interest rates.

However, pro-growth initiatives such as an infrastructure spending bill and comprehensive tax reform have taken a backseat to the push for the passage of healthcare reform.

Even though predicting legislation progress can be a futile endeavor, Republicans have signaled that something could be done before year-end on the tax reform effort. Materially lowering the corporate tax rate to 15% (as suggested previously by the Trump Administration) would be viewed positively by the equity market.

A territorial tax system (border tax) would place the US tax system on equal footing with that of other tax systems around the world since the US is the only developed economy that does not impose a “border tax.” While Congress continues to struggle with legislation, House Speaker Paul Ryan has communicated a goal of introducing a tax legislation in the House in the early fall with the objective of passing final legislation before year-end.

With the economy continuing to hum along, and the hope that Congress can pass legislation that will help the economy continue to work, investors have drawn their attention to monetary policy throughout the world, with the key question: when do interest rates “normalize”?

Given what has transpired throughout the world with the extraordinary accommodating monetary policies through quantitative easing (QE), asset purchases by central banks and near zero to negative interest rates throughout the world, the definition of a “normalized” environment can be hard to define. The next two graphs illustrate what has transpired over the past 17 years: Central Bank’s asset portfolios and the US Federal Funds Rate.

In June, Federal Reserve policy makers raised the Federal Funds Rate by 25 basis points to a range of 1% to 1.25%. This is their fourth, quarter-point raise since December 2015. In addition to raising short-term rates, the policymakers laid the framework for the normalization (shrinking) of the Central Bank’s large portfolio of bonds and assets that has accumulated over the past several years due to QE policies. As illustrated in Graph 1, central banks throughout the world have increased their balance sheet significantly with the QE programs implemented since the financial crisis of 2008 to help spur economic growth.

Central banks would prefer to gravitate towards the process of “normalizing” in order to provide optionality to address future economic stimulus in recession periods. Historically, central banks have addressed recessions with typical monetary policies such as setting short-term interest rates.

A lowering interest rate environment encourages investment, while a tighter monetary policy (higher interest rates) helps to cool an overheating economy. Graph 2 illustrates the lack of flexibility the Federal Reserve currently has to affect the economy with monetary policy with its fed funds rate significantly lower than historical levels. The shaded area on the graph represents recessionary time periods.

While the Federal Reserve officials have laid the framework to slowly shrink the Central Bank’s large portfolio of bonds and other assets ($4.5 trillion), it is widely anticipated that they will start the plan in September; the Fed has also indicated that it will unlikely decrease to a level seen before the financial crisis of 2008 (under $1 trillion).

A factor that continues to concern policymakers is the lack of inflation. The Fed’s preferred inflation gauge briefly surpassed the Central Bank’s 2% target in February but posted a greater than expected drop since then, having risen just 1.4% on the year ending in May.

A low level of inflation is a concern to the Fed because it calls into question whether the Central Bank will be able to keep raising rates to what it considers normal levels without damaging the economy. As we have previously mentioned over the years, we see limited upward pressure for inflation, with technology widespread in all facets of consumers’ lives.

For example, excluding a major disruption in the Middle East, energy prices should remain low as US oil and gas producers continue to increase production and export oil and gas throughout the world by using technology to lower their production costs.

Additionally, competition within the US grocery industry is set to increase with the entrance of Lidl, one of the world’s largest retailers based in Germany, and grocery discounter Aldi’s plans to invest nearly $5 billion over the next five years expanding its own footprint. This was before Amazon announced it was acquiring the upscale grocery chain Whole Foods in June.

The competition for consumers’ wallet share is getting fierce with no signs of slowing and, because of this, food prices, similar to a lot of consumer goods the past several years, will likely see downward pressure. Multiple Fed policymakers believe that the recent downticks in inflation are “temporary,” but time will tell.

If somehow inflation is able to tick upward towards the 2% Fed goal, then we would expect to see another quarter-point increase in the Federal Funds Rate before year-end. If inflation continues to lag, it is likely that multiple policymakers on the fed committee will be reluctant to increase rates given how data dependent the Fed has been over the past decade.

From a market risk perspective, we remain concerned about the influence that passive investments, such as ETFs and index funds, could have on stock prices in a volatile market. Barron’s recently mentioned a point that the dramatic increase of passive investments have put a large amount of stock ownership that isn’t tied to the fundamental performance of the company, nor its valuation. For instance, Vanguard Group owns 5% or more of 491 companies in the S&P 500, up from 116 in 2010.

While ETFs are known for lower fees than actively-managed mutual funds, there are times when the underlying securities price-per-share within the ETF and the price of the ETF security are trading at a disparity, which hides the true costs to the shareholder.

A recently published study in the Financial Analysts Journal looked at approximately 1,800 ETFs from 2007 to 2014 and found that the harder the underlying securities in the ETF are to trade, the bigger the gap between actual securities price versus the ETF gets. With the increased passive ownership limiting the float available for the stock to trade, the number of underlying securities that could have potential difficulty in trading has increased. The author of the study concluded that an ETF portfolio could be costing investors 1% or 2% without the shareholder knowing it.

A flash crash on August 24, 2015 halted trading in almost 20% of US listed ETFs, and we believe that foretells the problem that the passive strategies will have in times of great market volatility.

With the markets continuing their strong move from the first quarter into the second, we could see the market take a “breather” during the summer months, but we would recommend being opportunistic on any pullback in the market, particularly on good companies selling at attractive valuations.

From an income-generation perspective, we continue to seek good quality, high-yield bonds with short duration to minimize negative impact to raising interest rates. We also continue to seek dividend paying stocks that should have strong fundamentals to their underlying businesses to potentially allow the dividend to grow.

If comprehensive tax reform or an infrastructure spending bill materializes in the Fall, we believe the market will have a strong finish into the end of the year.

Q1 2017 – “Trump Trade Fade”

Q1 2017 – “Trump Trade Fade”

The first quarter ended with the stock market completing its eighth year of the current bull market, with the Standard and Poor’s 500 Index advancing 6.07%, marking the sixth quarter in a row the index closed in positive territory. Not only was the past quarter one of the least volatile quarters in some 50 years, the sectors that performed well were the stocks that lagged during the fourth quarter last year, as the “Trump Trade” faded. As long as the world economy continues to strengthen, inflation inches upward in a controlled manner, and Congress makes headway on U.S. tax reform and an infrastructure investment bill, we anticipate a favorable environment for investors throughout the world. We believe the market is poised to continue to produce positive returns this year as U.S. companies are also expected to report the strongest quarterly earnings in years for the first quarter.

During March, the Federal Reserve raised the federal funds rate by 25 basis points to a range of 0.75% to 1.00%. This move was widely anticipated by the market, and as the economy continues to remain healthy, another two rate increases are expected by year-end. Assuming that there are two additional 25 basis point increases before year-end, the federal funds rate would range between 1.25% – 1.50%. This would mark the first time since 2008 that the federal funds rate has risen above 1.00%. While there is a chance that the Fed could raise rates at a faster pace than three increases this year, most believe that a gradual path of rate increases is most likely.

Contrary to the visibility provided to its plan of raising rates through the fed funds, the Federal Reserve has been much more guarded with the plan to shrink their balance sheet. Before the financial crisis of 2007 – 2008, their balance sheet was less than $1 trillion, but through multiple quantitative easing programs, it has ballooned to a $4.5 trillion portfolio of treasury and mortgage securities. During its March policy meeting, the Federal Reserve officials discussed that they would likely begin to shrink the portfolio later this year. The most likely scenario in reducing their balance sheet would be to reinvest only a portion of the maturing principal amount instead of reinvesting the full amount into similar securities. We believe their balance sheet plan will be a measured and cautious reduction over time in conjunction with walking the tightrope of maintaining a systematic approach in returning interest rates to a more “normalized” level to increase the optionality for the Fed to stimulate a slowing economy during the next down-cycle.

Equity markets outside of the U.S. also produced a strong showing during the quarter as global economic data has been consistently improving so far this year. In December, the European Central Bank announced that it would dial back its monthly bond buying program in April 2017 from 80 billion euros ($86 billion U.S.) a month to 60 billion euros a month until at least December 2017. And with the tapering of the buying program in sight, underlying sovereign interest rates are starting to increase. For example, the yield on Germany’s 10-year government bond more than doubled, rising 18 basis points year to date to 0.39%. But even with the doubling of the yield on the German Bund, foreign buyers continue to struggle to find attractive absolute yield within the Eurozone. In fact, strong foreign investment in U.S. Treasury’s is keeping a lid on government bond yields and while the U.S. Treasury yield curve is higher than last year, it is down from levels seen last month (see yield curve below). The consensus expectation is that the yield on the 10-year Treasury will be 3.00% to 3.50% by year-end (compared to its current yield of 2.37%) but that is dependent on the economy continuing to be strong, and assumes the Fed will continue to follow its plan of two additional rate increases before year-end.

While optimism is prevalent there are always unforeseen factors that could adversely affect the market. Geopolitical risks seem to become more elevated by the week and naturally investors’ appetite for entering into another conflict throughout the world is low. Market participants would rather cheer on legislation that could help spur on economic growth. But even on that front, despite having a majority in both the House of Representatives and Senate (as well as occupying the White House), the Republicans have so far proven slow to govern, with a health care reform proposal stalling in the House of Representatives. The inability to even bring the Affordable Healthcare Act to a vote in the House, after previously voting to repeal Obamacare more than 60 times in prior sessions, leads to serious questions as to whether President Trump’s pro-growth agenda will be able to get off the ground.

With the April congressional recess now at hand, Congress will have just three months to address tax reform and an infrastructure plan until another full month recess in August. It has been more than 35 years since any major tax reform has occurred in America, so it will be unlikely that a change will take place within a three-month period, but any increased visibility on changes being discussed could help investors determine the potential benefit to the economy and businesses. A significant portion of earnings growth since the Great Recession has been driven by operational efficiencies (cost cutting), but a moderate amount of inflation and positive tax reform could help propel corporate earnings to the next leg of earnings growth. Regardless, any revisions to tax and regulatory policies should reinvigorate economic growth. An additional jolt to the economy could be any move on President Trump’s infrastructure plan, which while lagging details, has been described by one of the President’s Cabinet members as an investment program valued at $1 trillion over 10 years focusing on multiple sectors outside of transportation infrastructure, including energy, water and potentially broadband and veterans hospitals.

In closing, we mention another factor that could likely influence volatility into the marketplace which is the growth of passive investment vehicles. Over the past decade, passive index strategies have become a larger portion of the investment landscape. There are roughly 2,000 U.S.-listed ETFs in existence, with roughly 20 ETFs accounting for more than a third of all ETF assets in broad market indexes, such as the S&P 500. As capital flows into and out of these funds, there is indiscriminate selling or buying as the funds true up the positions to match their respective benchmark by the end of the trading day. For instance, after President Trump’s State of the Union speech on February 28th, during the following day, nearly $8.2 billion poured into the SPDR S&P 500 (SPY), the world’s largest ETF. Active managers have the luxury of making real time allocation decisions to accommodate the net flows into their funds, but ETFs must invest their portfolio by the end of the market close to mirror its respective index, regardless of valuation considerations or liquidity of the underlying securities. With flows of this magnitude for the SPDR ETF, it would represent nearly 9.4% of the average daily volume for the top 100 thinly traded securities within the S&P 500, with some of the securities accounting for mid-teens to 20% of the average daily volume.

A recent financial publication article that noted that the stocks whose daily trading volumes were most affected by ETF flows also performed the best, concluding that investors should not expect significant outflows to take stocks down. We would have a different assessment given the basic rule of supply and demand and influences of the movement of capital and would caution investors to understand their exposure to the market, particularly in the latter stages of the economic cycle.