Q2 2022 – “Lessons Learned During Previous Bull and Bear Markets”
The U.S. equity and fixed income markets suffered significant losses during the 2nd quarter, as persistent high inflation and a continuation of more mundane but important supply side challenges further soured investor sentiment. The inflation has been driven by overly-stimulative fiscal and monetary policy in reaction to the pandemic, as well as high labor, energy, and other commodity cost inputs driven by supply and demand imbalances. Reasons for the imbalances have been well documented and include underinvestment due to government policies, limiting new supply relative to demand for oil and gas, along with Russia’s invasion of Ukraine exacerbating the supply problem for energy and other key commodities, such as wheat. Progress on supply chain issues were hampered by the recently-ended COVID-related lockdowns in Shanghai and Beijing (where cases have started rising again). The labor market has been tight due to low worker participation rates.
These challenges have prompted the Federal Reserve (the “Fed”) to begin increasing interest rates more aggressively to bring inflation down. Earlier this month the Fed increased its Federal Funds Rate (the price banks charge each other for overnight money) target by 75 basis points (3/4 of 1%), bringing total rate hikes to 1.5% so far this year. Additional short term rate hikes are expected in July, later this year, and into next year, with the aim of quelling inflation by decreasing demand; the Fed’s challenge is successfully taming inflation without causing a recession. The Fed is powerless to increase the supply of key energy products (and higher rates will offset some of the incentive to invest in more capacity provided by higher commodity prices). The market has reacted harshly to this expected slowdown and potential recession, with the major indexes all having reached bear market territory of down 20% or more from the recent highs from early January 2022.
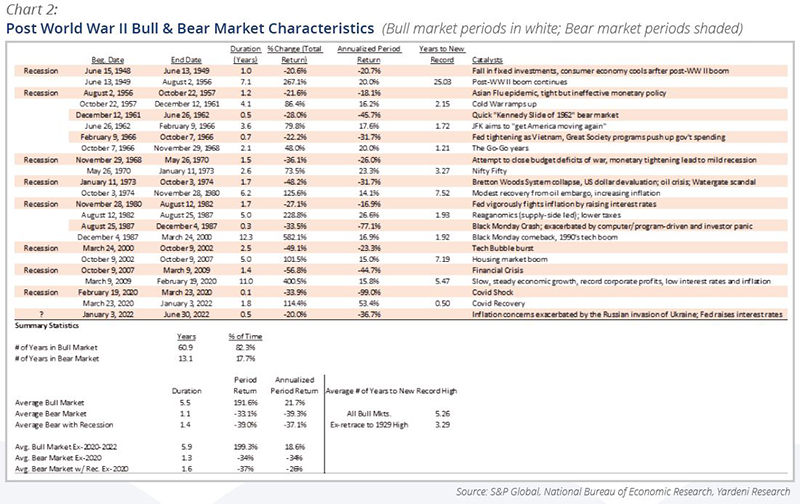
The tables below shows past bull and bear market cycles since the end of World War II, though there are limitations given outlier data exists (e.g., the annualized returns in the COVID periods).


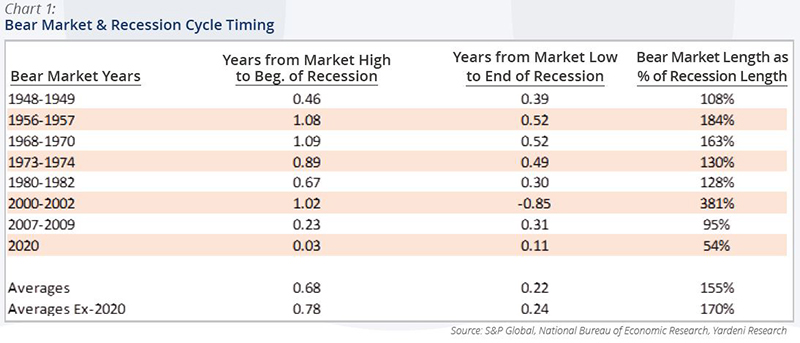
Bear markets associated with recessions have led to higher absolute losses (but similar annualized losses) and have lasted longer at close to 1.5 years. One of the challenges of applying lessons from past bear markets is that recessions are not officially classified until well after they begin and end; moreover, there have been official recessions during periods without a bear market (e.g., the 1953-1954 post-Korean War and the 1990 recessions). Knowing recession start dates would also be of limited help since some market tops have occurred almost simultaneously with the beginning of recessions (e.g., the Great Recession in 2007 and the 2020 COVID Recession) while others have started well in advance (e.g., the market topped about one year in advance of the official beginning of the 1957, 1969, and 2001 recessions).
Historically, bear markets have lasted longer than recessions, and markets have tended to bottom about 3-6 months before the official end of a recession, but there are exceptions, such as the market downturn extending beyond the end of the recession following the “dot.com” bubble burst in the early 2000s. Unsurprisingly, it has usually taken more time to retrace to the previous high, following bigger market declines.
While examining past market cycles is interesting, it does not provide a magic formula for investors trying to determine the market bottom. Many in the press are trying to compare the current situation to prior bear markets/recessions, but there are no perfect parallels. The high-inflation / low-growth period of the mid- to late-1970s is most often cited because of a similar run up in energy prices driving broader inflation. Oil prices first shot up during the first OPEC embargo in 1973-1974 and continued to modestly increase throughout the rest of the decade, until the second oil shock (from lower Iranian oil production following its Islamic Revolution) caused oil prices to more than double from March 1979 to April 1980.
Beyond supply and demand, the U.S. dollar (the currency commodities like oil are priced in) was being devalued relative to other world currencies during the 1970s in the aftermath of the Bretton Woods monetary system collapse, following then-President Nixon’s decision to stop using the gold standard in 1971. The dollar hit a low in October 1978 but did not begin to appreciate substantially and durably until October 1980, just after the oil price peak in April 1980. In contrast, the U.S. dollar has been steadily appreciating over the past year to about 20-year highs against most major currencies, as the higher relative interest rates from Fed tightening help make the dollar comparatively more attractive. The dollar rallied during the bear market of the early 1980s as the Fed began to aggressively raise rates to quell inflation, which contributed to more confidence in the U.S. dollar and decreasing oil prices from 1980 through 1985. And that could happen again throughout this bear market. But dollar strength in this regard might only mean the U.S. is not disadvantaged as much.
Other countries’ weakening currencies might serve to crimp their demand for oil and other commodities even more; the Fed’s actions truly have worldwide consequences. However, though it might help on the commodity price front, an appreciated dollar also makes U.S. exports less competitive, which could hurt companies with significant foreign sales exposure; it would also reduce the amount of earnings reported by companies translating their foreign units’ local earnings. Potentially offsetting to that is the comparative attractiveness of investing in U.S. assets for foreigners expecting continued dollar strength.
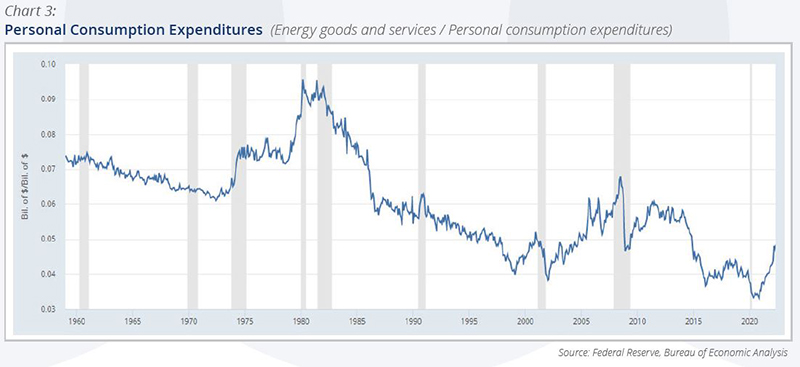
There are other differences between then and now. The economy of the 1970s was driven more by demand for goods compared to services, thus arguably making the U.S. economy less vulnerable now to commodity price shocks (though certainly not immune). Chart 3 shows that energy costs are a much smaller share of U.S. consumers’ overall spending now than they were 40-50 years ago and still represents below 5% of total personal consumption expenditures as of late spring, despite oil and natural gas price surges following Russia’s invasion of Ukraine.

It is impossible to know how much the Fed will need to raise interest rates and how long the process will take to bring inflation back to its targeted long-term 2% annualized rate, or how much the economy might grow or contract during this downcycle. It is equally impossible to know exactly how and when the market will react along the way. It will be determined in large part by how effectively the rate hikes work and whether the Fed can manage a soft economic landing during which the higher interest rates slow the economy but do not cause a recession. It will also depend on how quickly supply-related challenges can be overcome. Concerning the latter, it will take time (and, some would argue, less hostile regulation of the oil and gas industry in the U.S.) for energy markets to bring meaningful additional capacity to market. In the meantime, higher interest rates will slow U.S. demand for houses and related home furnishings, cars, and other big ticket goods, and for capital investments by businesses; indeed, most commodity prices, including energy prices, have come down from recent highs during the just-completed quarter in anticipation of interest rate-induced slackening demand.
Additionally, wage inflation tends to be stickier than commodity-induced inflation, and so is worth watching for the longer-term inflationary trend. The labor market has remained tight, and workers have been able to negotiate pay increases (albeit more recently not exceeding inflation), with many businesses struggling to find enough qualified workers. It will be interesting to see if the labor force participation rate ticks up as COVID stimulus savings are used up in the coming months and how that impacts future wage trends.
But the market will have made up its mind long before economists make their backwards-looking proclamations.
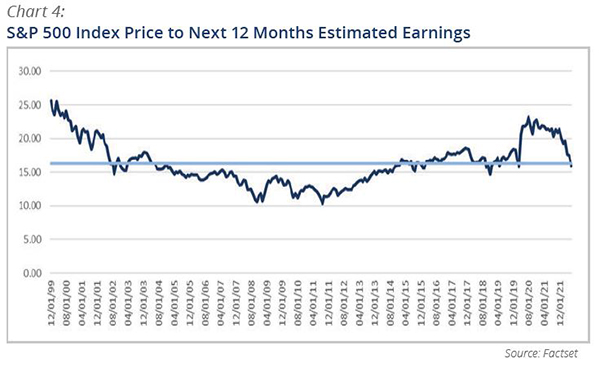
As shown in Chart 4, the market’s valuation, as measured by the “price-to-expected next 12 months earnings ratio” is close to the 30-year average, suggesting that the market may not have fully capitulated; additionally, some are fearful that earnings estimates are too high and are bracing for negative earnings estimate revisions. Plus, this bear market is younger than most prior bear markets, suggesting it might be best to wait and be extra selective. Both the Fed and the markets will be carefully watching key economic data to guide future decisions.

The number and pace of interest rate hikes will be driven by inflation, employment, and other key economic data points, and the market will take cues from Fed officials’ commentaries. The market will also be digesting upcoming earnings reports to ascertain how demand and margins are holding up, as it looks for reasons to believe the worst is behind, and climb the proverbial wall of worry into the next bull market. We suspect the markets could be more volatile than usual in the coming months, as economic data indicates which way the economy is heading.
Though the history is mixed, and gleaning specific market timing insights from past bear market cycles is a fraught exercise, we believe KCM’s investment approach works. We believe trying to time the market is a dubious exercise, and that it is important to be patient while waiting for stocks to become attractively-priced based on realistic expectations of companies’ financial prospects (in both bull and bear markets). We believe stocks are one of the most attractive and liquid stores of long-term value that offer a chance for capturing income through dividends and growth over the long term; and that companies with strong management teams, and products and services that are in demand can pass along inflated cost inputs over time to maintain attractive full cycle margins.
As interest rates reset during this cycle, we could get a chance to finally lock in attractive rates on the fixed income side, which in recent years has offered insufficient yield to incentivize moving out farther on the yield curve (i.e., locking in for the long term) or down in quality when compared to the dividends (and potential growth) that could be earned through investment in safe, financially secure equities.
At KCM, we are busy testing assumptions and redoubling our efforts on behalf of clients to confirm that the companies we own are financially-secure and capitalizing on opportunities efficiently. Times like these often present great opportunities for businesses and investors alike, and we aim to help our clients prudently capitalize on them. Many clients have been with us through multiple bear markets and understand that we have the experience necessary to weather them. They know that our focus on high quality companies with strong balance sheets in diversified businesses has worked best during the downturns, and that outperforming in the downturns is a key contributor to superior long-term performance. While not immune from market weakness, those are the kinds of companies that survive during times of economic weakness while preparing for growth when it returns. We appreciate our clients’ loyalty, and endeavor to retain their trust throughout all phases of the market cycle.
~ KCM Portfolio Management Team ~
