Q4 2018 – “2018 Ended on a Sour Note – How Will 2019 Begin?”
Download newsletter in PDF format
Worries about rising interest rates, the continuing trade friction between the U.S. and China, and geopolitical tensions tempered risk appetites among investors in the 4th quarter. For the first time since The Great Recession of 2008, the S&P 500 Index posted a loss for the year. From a market cap standpoint, shares of small U.S. companies, as measured by the Russell 2000 Index, underperformed their larger cap S&P 500 peers (-20.2% vs. -6.2%, respectively) in the 4th quarter. This represents a shift from earlier in 2018 when investors shunned larger cap companies for more U.S.-centric, smaller cap companies to mitigate trade tension risks.
We often use an analogy of climbing a tree to represent the market’s temperament in a given cycle. When market valuations are low, as they were at the end of 2008, it’s comparable to starting to climb a tree from the ground up. There isn’t a high degree of risk or a significant distance to fall. However, as one climbs and reaches the upper limits of the tree, the mind starts to focus more on outside variables: the wind, the height above the ground, the brittleness of each branch, etc. Senses tend to be more aware of the variables because of the consequences of a wrong decision. Similarly, when the market is well into an upcycle, such as currently, the data point that didn’t move the market early in the cycle suddenly becomes the most significant factor of the moment and can drive indexes up and down considerably.
The intra-day and day-to-day market moves experienced this past December were extraordinary. While it is tempting to compartmentalize the various factors impacting the market, it is never as neatly demarcated as we like to think. We believe a portion of the heightened volatility can be attributed to the increased popularity of passive investing over the past decade, where a push of a button can instantly buy or sell a portfolio of securities with no consideration of valuation. Roughly 85% of the daily trading volume of the U.S. stock exchange is being attributed to machines, models, or passive investing formulas. When so much capital mirrors popular benchmarks, the buying and selling of securities can be described as a herd mentality.
Recently, the Federal Reserve also became an external factor from which the market closely took its cues. Late in the year the market had a brief, strong rally after Fed Chairman Jerome Powell hinted at reduced enthusiasm for interest rate increases in 2019, which was different from the forward guidance signaled from its September meeting. The Fed’s quarterly economic projections showed a median forecast of two rate hikes in 2019 (down from three in September). As the market digested the news and the Fed raised interest rates by 0.25% in December, the continued downdraft in the market was a signal from the investment community that perhaps there shouldn’t be any rate increases in 2019.
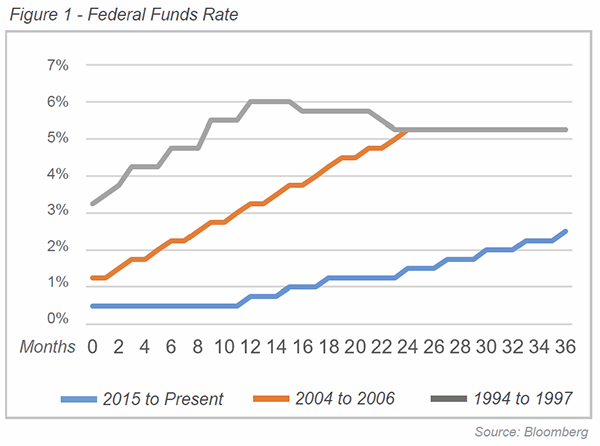
Compared to the last two tightening cycles (1994-97 and 2004-06) this Fed has made remarkably few rate increases. During the 1990s and 2000s, when Alan Greenspan served as Chair, the Fed was known for its “measured pace” of rate increases. In fact, during one 12-month period, the Fed raised short-term rates nine times in 0.25% increments. Compared to that period, the current rate of increases gives a whole new meaning to “watching paint dry”. As illustrated in Figure 1, this past December’s rate increase (the blue line) marks only the 9th increase in 36 months!

The goal of the Fed, in a growing economy that doesn’t require stimulus, is to achieve a “neutral rate” that neither spurs nor slows growth. The recent comments from the Fed seem to indicate that the neutral rate is lower than it used to be and could account for some of the slower pace, as smaller changes in the Federal Funds rate could have outsized effects.
Investors appear uncertain about how to adjust to the changing dynamics of the central banks’ role in the marketplace. After a decade of quantitative easing, when central banks throughout the world became a new “buyer” by implementing the novel crisis-response tool of purchasing assets from the public, they are now looking to exit the market. Over the past number of years, this new “buyer” helped the stock market rally and decreased the cost of credit. While the U.S. Fed began tapering its balance sheet (exiting the market as a buyer) in mid-2017, other central banks throughout the world were only starting to slow quantitative easing policies and to proceed down the path of quantitative tightening, although this process is expected to accelerate throughout 2019.
As we’ve noted in past newsletters, the Fed has admitted that the effects of years of quantitative easing, and now quantitative tightening, are largely unknown. While the decrease in the Fed’s balance sheet has been running for more than a year, the Fed has increased the dollar amount of securities that will roll off its portfolio this year to $150 billion a quarter, up from $30 billion a quarter when the process began. While it is difficult to isolate one underlying factor as the root cause of the recent market turmoil, one could ask, “If quantitative easing provided significant benefit to asset prices over the past decade, what costs will the opposite effect have?”
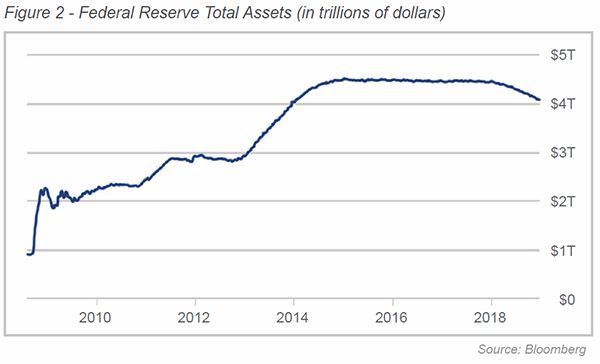
On this front, investors were seeking reassurance from Chairman Powell that the Fed would be responsive to balance sheet reductions in the future instead of stating that reductions were on “autopilot”. However, as illustrated in Figure 2 below, the deleveraging of the Fed balance sheet is proceeding just as quickly as the rate hikes have over past three years… a “glacial” pace. The Fed’s holdings have only fallen to $4.1 trillion from $4.5 trillion a year ago and are expected to drop to $3.6 trillion by the end of 2019. In addition to the U.S. central bank attempting to “normalize” its balance sheet, the European Central Bank (ECB) ended its own bond buying program in December, meaning the largest central banks’ balance sheets will decline next year for the first time this decade.

Meanwhile on the corporate front, U.S. companies diverted an increasing amount of their reduced tax burdens to shareholders in the form of dividends in 2018. As of November 2018, companies in the S&P 500 Index increased their dividends by 7.7% over the last year, paying out nearly $421 billion versus $391 billion in 2017. Goldman Sachs is predicting that 2019 dividends will increase by as much as 6%.
Even with this projected increase dividend payout, tax reform is allowing corporate America to put more cash into its coffers. As of mid-December the dividend-payout ratio for the S&P 500 Index was 33%, down from pre-corporate tax reform levels of 38%. 2018 also marked the all-time record for U.S. corporate stock buybacks. Approximately $800 billion of stock was bought back amid total announcements of $1.1 trillion. As with dividends likely to increase in 2019, the trend of stock buybacks is also likely to increase into 2019, assuming corporate America continues to generate significant free cash flow.
Companies will have to find other ways to provide earnings growth this year, following 2018’s one-time benefit, produced by the sweeping corporate tax cut. Analysts are estimating corporate earnings growth will drop by more than half in 2019, to 8.3% versus 21% in 2018. While the U.S. economy continues to give the appearance that all is well and the Fed estimates that the economy will grow at a rate above 2%, the market doesn’t share the same sentiment.
There are two critical factors impacting stock prices and the probability of positive returns for 2019 in our view — the condition of the global economy and the resolution of trade disputes. The first factor impacts companies’ ability to grow revenues, while the latter impacts their profitability by increasing costs. With the Brexit deadline fast approaching, China feeling the pain of a slower global economy, and Europe’s lackluster economy, global growth probably isn’t going to surprise on the upside in 2019. Meanwhile, the U.S. has given China until March 1st to avoid higher tariffs, by addressing complaints it discriminates against foreign companies and steals their technology. A resolution of this trade dispute could significantly boost stock market potential in 2019.
Interestingly, in spite of the concerns, issues, and volatility, a major global study by Schroders found U.S. investors expect their investment portfolios to return about 8.5% annually over the next 5 years. The study found that millennials, defined as those respondents between the ages of 18 and 36, believed they would get an annual return of 11% over this period. The S&P 500 has achieved an 11% return or better 22 times in the past 40 years, so it is definitely possible. However, the unknown is how this segment of the population, who have likely only experienced an investment environment where the Fed had its back, will handle negative returns for multiple years or if the market reflects a period similar to 2000 to 2009, that only beat the 11% expectation three times in 9 years.
With the increase in market volatility and late cycle prospects, it remains imperative to be aware of your surroundings but to not panic “high up in the tree”. The recent market action will allow patient investors an opportunity to capitalize on attractively-priced, financially-strong, and well-managed companies as the market indiscriminately throws the baby out with the bathwater.
