Q2 2017 – “Outlook for the Remainder of 2017″
With the momentum in the market carrying over from the first quarter, the first half of 2017 has been the best start for global equities since 1998. Although equity markets outside of the United States were up more, the Standard and Poor’s 500 (S&P 500) had its best first half of the year since 2013. International markets performed well as confidence in economic recoveries around the world have been gaining or surpassing growth in the US. While there were pullbacks in the marketplace during the quarter, the market continued to bounce back with the S&P 500 setting 24 new closing records.
The world economy continues to strengthen. In early July, the first quarter Gross Domestic Product was revised upward to 1.4%, better than initial expectations. The US job market continues to be strong, adding 222,000 new positions in June, and the unemployment rate at 4.4%. The recent Labor Department report also showed that there were 6 million unfilled job openings as of the end of April, the most since it started keeping track in 2000. While the employment picture looks bright, wage growth has only been modest, possibly held down by the weak pace of productivity growth in recent years.
Throughout the world, economies have been recovering and central banks have been contemplating normalizing their balance sheets. This has had a negative impact on the dollar, as it suffered its worst stretch in six years during the first half of 2017, beginning down 5.6% year-to-date against a basket of major currencies, distinguishing the greenback as the worst performing among the major currencies. However, a weaker dollar will actually help US multi-international companies with international sales, as prices on US products become more competitive in the foreign market, further helping the US economy.
Nonetheless, putting the recent decline of the dollar into proper context, this past November the dollar was at a 14-year high right after the US presidential election as the pro-growth platform that President Trump outlined in his presidency bid excited investors on the prospects of strong economic growth and higher interest rates.
However, pro-growth initiatives such as an infrastructure spending bill and comprehensive tax reform have taken a backseat to the push for the passage of healthcare reform.
Even though predicting legislation progress can be a futile endeavor, Republicans have signaled that something could be done before year-end on the tax reform effort. Materially lowering the corporate tax rate to 15% (as suggested previously by the Trump Administration) would be viewed positively by the equity market.
A territorial tax system (border tax) would place the US tax system on equal footing with that of other tax systems around the world since the US is the only developed economy that does not impose a “border tax.” While Congress continues to struggle with legislation, House Speaker Paul Ryan has communicated a goal of introducing a tax legislation in the House in the early fall with the objective of passing final legislation before year-end.
With the economy continuing to hum along, and the hope that Congress can pass legislation that will help the economy continue to work, investors have drawn their attention to monetary policy throughout the world, with the key question: when do interest rates “normalize”?
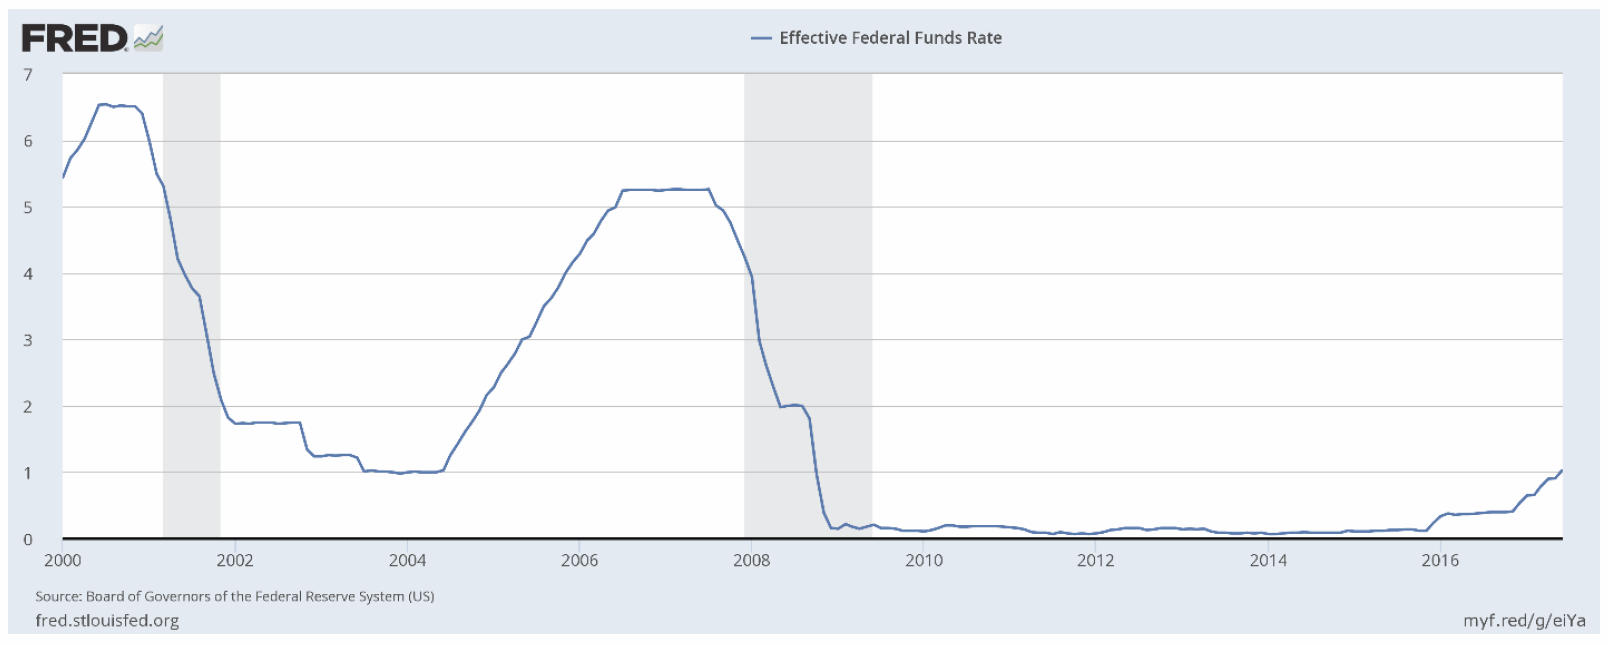
Given what has transpired throughout the world with the extraordinary accommodating monetary policies through quantitative easing (QE), asset purchases by central banks and near zero to negative interest rates throughout the world, the definition of a “normalized” environment can be hard to define. The next two graphs illustrate what has transpired over the past 17 years: Central Bank’s asset portfolios and the US Federal Funds Rate.
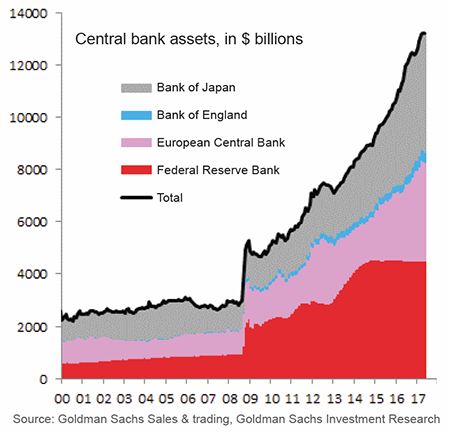
In June, Federal Reserve policy makers raised the Federal Funds Rate by 25 basis points to a range of 1% to 1.25%. This is their fourth, quarter-point raise since December 2015. In addition to raising short-term rates, the policymakers laid the framework for the normalization (shrinking) of the Central Bank’s large portfolio of bonds and assets that has accumulated over the past several years due to QE policies. As illustrated in Graph 1, central banks throughout the world have increased their balance sheet significantly with the QE programs implemented since the financial crisis of 2008 to help spur economic growth.
Central banks would prefer to gravitate towards the process of “normalizing” in order to provide optionality to address future economic stimulus in recession periods. Historically, central banks have addressed recessions with typical monetary policies such as setting short-term interest rates.
A lowering interest rate environment encourages investment, while a tighter monetary policy (higher interest rates) helps to cool an overheating economy. Graph 2 illustrates the lack of flexibility the Federal Reserve currently has to affect the economy with monetary policy with its fed funds rate significantly lower than historical levels. The shaded area on the graph represents recessionary time periods.
While the Federal Reserve officials have laid the framework to slowly shrink the Central Bank’s large portfolio of bonds and other assets ($4.5 trillion), it is widely anticipated that they will start the plan in September; the Fed has also indicated that it will unlikely decrease to a level seen before the financial crisis of 2008 (under $1 trillion).
A factor that continues to concern policymakers is the lack of inflation. The Fed’s preferred inflation gauge briefly surpassed the Central Bank’s 2% target in February but posted a greater than expected drop since then, having risen just 1.4% on the year ending in May.
A low level of inflation is a concern to the Fed because it calls into question whether the Central Bank will be able to keep raising rates to what it considers normal levels without damaging the economy. As we have previously mentioned over the years, we see limited upward pressure for inflation, with technology widespread in all facets of consumers’ lives.
For example, excluding a major disruption in the Middle East, energy prices should remain low as US oil and gas producers continue to increase production and export oil and gas throughout the world by using technology to lower their production costs.
Additionally, competition within the US grocery industry is set to increase with the entrance of Lidl, one of the world’s largest retailers based in Germany, and grocery discounter Aldi’s plans to invest nearly $5 billion over the next five years expanding its own footprint. This was before Amazon announced it was acquiring the upscale grocery chain Whole Foods in June.
The competition for consumers’ wallet share is getting fierce with no signs of slowing and, because of this, food prices, similar to a lot of consumer goods the past several years, will likely see downward pressure. Multiple Fed policymakers believe that the recent downticks in inflation are “temporary,” but time will tell.
If somehow inflation is able to tick upward towards the 2% Fed goal, then we would expect to see another quarter-point increase in the Federal Funds Rate before year-end. If inflation continues to lag, it is likely that multiple policymakers on the fed committee will be reluctant to increase rates given how data dependent the Fed has been over the past decade.
 From a market risk perspective, we remain concerned about the influence that passive investments, such as ETFs and index funds, could have on stock prices in a volatile market. Barron’s recently mentioned a point that the dramatic increase of passive investments have put a large amount of stock ownership that isn’t tied to the fundamental performance of the company, nor its valuation. For instance, Vanguard Group owns 5% or more of 491 companies in the S&P 500, up from 116 in 2010.
While ETFs are known for lower fees than actively-managed mutual funds, there are times when the underlying securities price-per-share within the ETF and the price of the ETF security are trading at a disparity, which hides the true costs to the shareholder.
A recently published study in the Financial Analysts Journal looked at approximately 1,800 ETFs from 2007 to 2014 and found that the harder the underlying securities in the ETF are to trade, the bigger the gap between actual securities price versus the ETF gets. With the increased passive ownership limiting the float available for the stock to trade, the number of underlying securities that could have potential difficulty in trading has increased. The author of the study concluded that an ETF portfolio could be costing investors 1% or 2% without the shareholder knowing it.
A flash crash on August 24, 2015 halted trading in almost 20% of US listed ETFs, and we believe that foretells the problem that the passive strategies will have in times of great market volatility.
With the markets continuing their strong move from the first quarter into the second, we could see the market take a “breather” during the summer months, but we would recommend being opportunistic on any pullback in the market, particularly on good companies selling at attractive valuations.
From an income-generation perspective, we continue to seek good quality, high-yield bonds with short duration to minimize negative impact to raising interest rates. We also continue to seek dividend paying stocks that should have strong fundamentals to their underlying businesses to potentially allow the dividend to grow.
If comprehensive tax reform or an infrastructure spending bill materializes in the Fall, we believe the market will have a strong finish into the end of the year.